Posts by: Andy Eschbacher
-
One of the most common reasons people make maps using CartoDB is to try and explore the patterns in their data in order to make better decisions or to communicate interesting ideas. This exploratory approach to location intelligence can be difficult, but armed with the right analytical workflows and cartographic approaches people can create incredible new value simply by using a map. In today’s blog post, I’m going to introduce a lesser-known method that can help you find interesting patterns in polygon data that a simple thematic map (e.g. a choropleth) alone may allow you to overlook.
-
Every year, all around the world, people celebrate all things geospatial in mid-November. It is a great opportunity to pick up new skills, learn new platforms, and -most importantly- make and share new maps.
-

I remember this one time at band camp, it seemed things were going so well. It was a wet, hot, good ol’ American summer. Possibly the only thing missing was a proper web mapping class, appropriately scheduled after friendship bracelet making class.
So in the spirit of awesome summer camps, last week we held CartoCamp Edu, a day full of discussions, presentations, and workshops in collaboration with talented educators to think through the uses of web mapping in the classroom.
-
With summer starting to wrap up in the Northern Hemisphere, so are trips to the beach, the mountains, or anywhere in between. What better time than now to highlight all the memories made with your GPS mobile device?
-
At the invitation of Eva Adler and Norman Shamas, I had the pleasure of giving a workshop on CartoDB’s real-time mapping capabilities for the TechChange class Mapping for Social Good. Eva Adler’s course covers an impressive array of material on web mapping related to global development work.
-
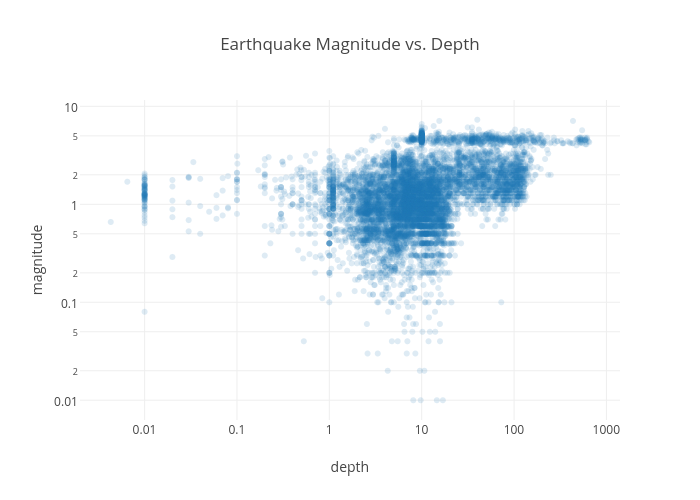
CartoDB, Plotly, and IPython notebooks work beautifully together. The plot above was made on Plotly from data imported into an IPython notebook using the CartoDB SQL API.
-
Let’s imagine the following scenario…
