Posts by: Angela del Carmen
-
In practice, journalist require the most trusty and reliable information to disseminate messages to the public. There is no better way to do that than by aggregating facts, or data, and analyzing and providing that analysis in the most accessible way possible. To do so, journalists across sectors and media need a technology that is compatible with the realities of the modern newsroom and provides data analysis on the go. CartoDB is that technology for the new media sector.
-

This year CartoDB will be at the Experience Fighters 2016 — the 3rd annual national meeting of Experience Design and Innovation at the Gran Teatro Principe Pío, here in Madrid, from May 11th to 12th! CartoDB is partnering
with #EXF, alongside with Designit, in order to gather the best creative professionals and UX Designers with new inspiring content that goes beyond their screensavers. -

Data velocity, variety, and volume are growing every second as more and more systems, from satellites, drones, to mobile devices, are designed for data gathering. We call this massive accumulation of data, Big Data. How we come to understand this collection of data can no longer be dependent on traditional forms of data analysis.
-
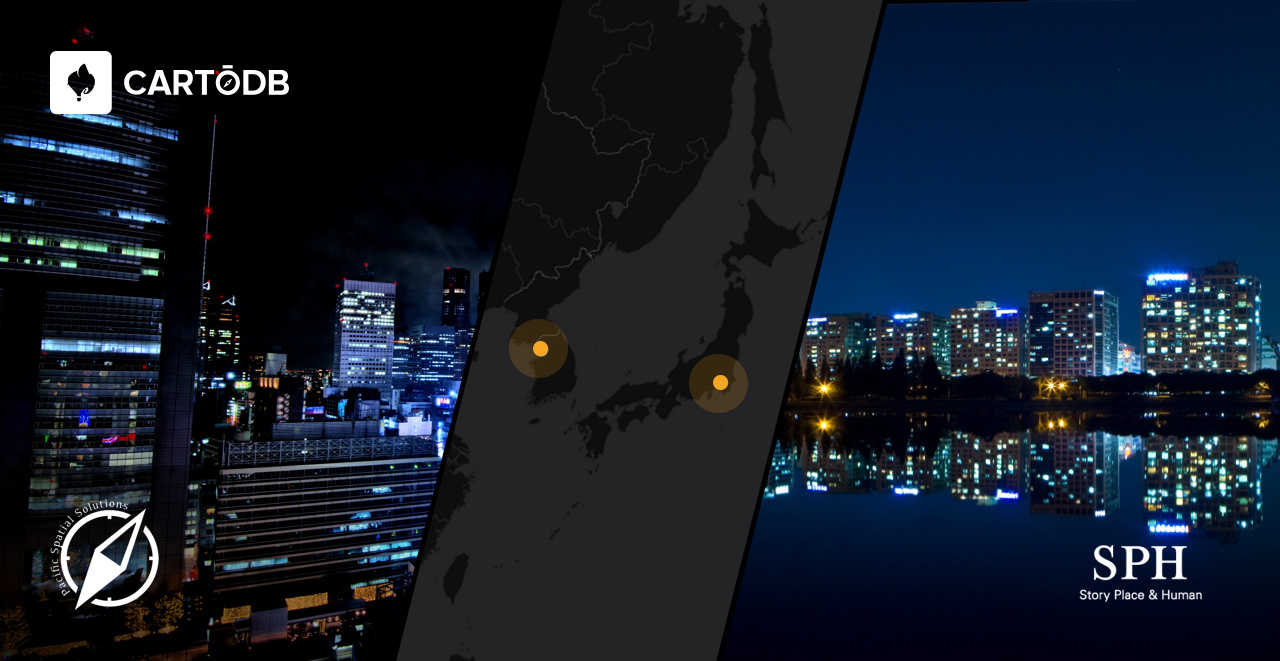
CartoDB loves going new places and exploring new things. That’s why we take risks with our technology and platform, which ultimately provide new insights for you and for us! So it is not surprising that we will be heading to South Korea and Japan, as we work to expand all our markets. While we are there, please don’t hesitate to email us to arrange a meeting to discuss location intelligence and better data analysis.
-
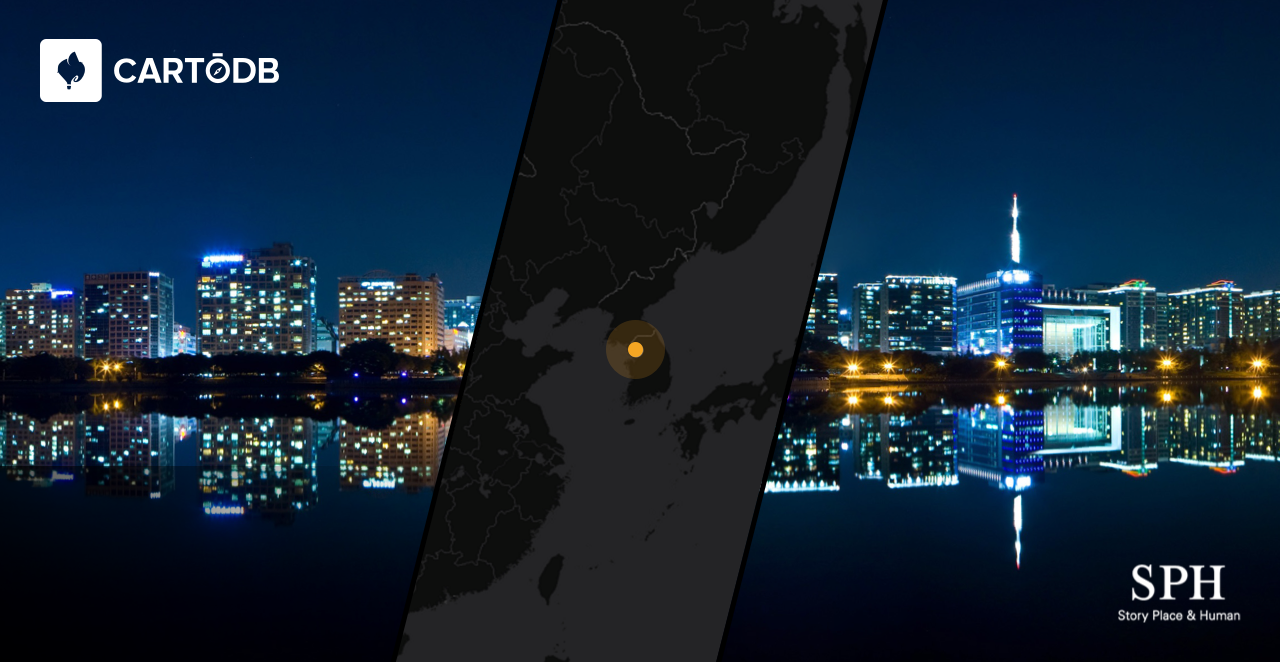
CartoDB loves going new places and exploring new things. That’s why we take risks with our technology and platform, which ultimately provide new insights for you and for us! So it is not surprising that we will be heading to South Korea. While we are there, please don’t hesitate to email us to arrange a meeting to discuss location intelligence and better data analysis.
-
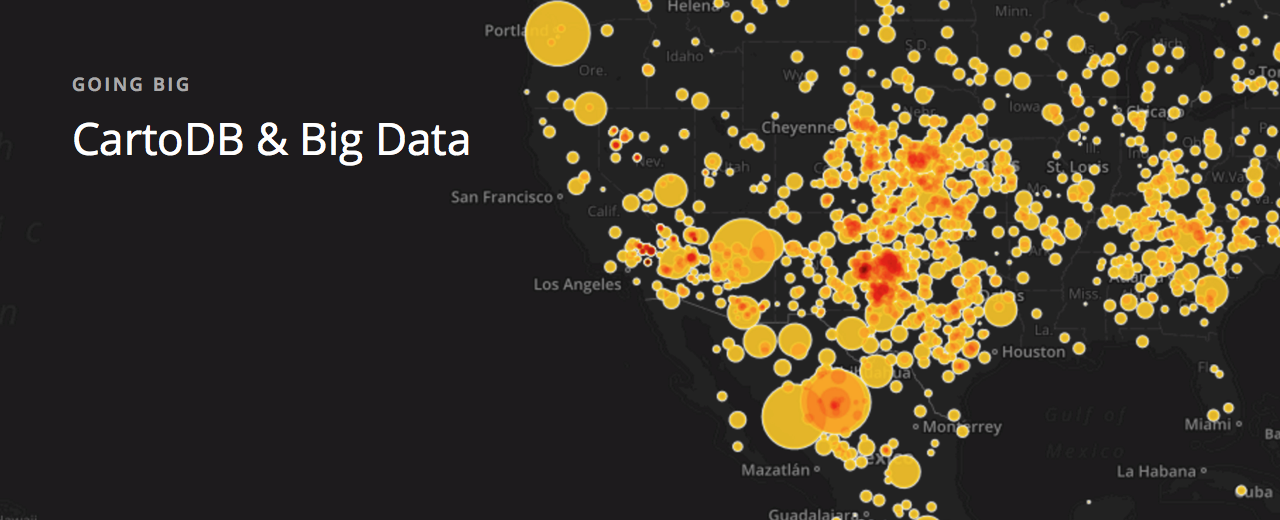
As we announced last week, today is the first day of Big Data week at CartoDB!
How can we begin to better understand and explain what big data is? Everyday we read in newspapers and social media the words ‘big data’ as it applies to businesses and systems of analysis and data aggregation. While it may seem like a marketing ploy, a critical approach to understanding what exactly big data is can provide new meaning to business intelligence.
-
What is constantly increasing its volume, variety, and velocity and greatly effects your business’s bottom line if not properly utilized? Big Data!
At CartoDB we know just how important the amount of data that you collect, how you understand and analyze that data, and how that analysis turns into better cost effective decision making for your organization is.
-

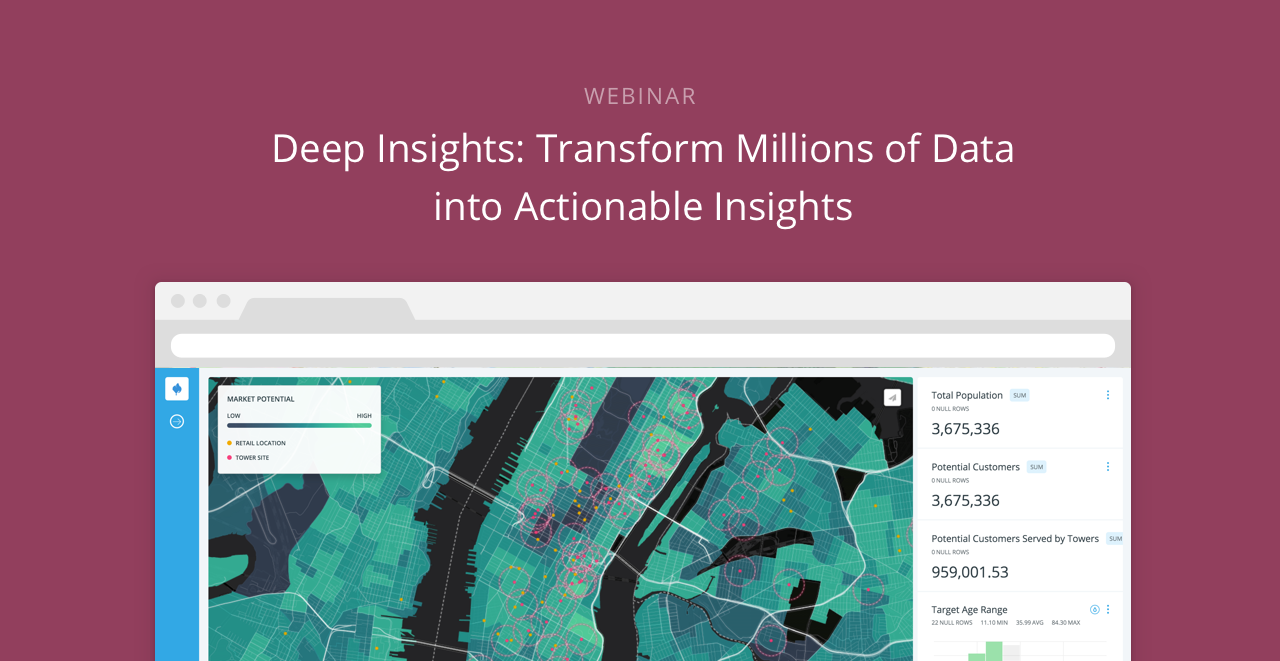
This month we announced our acquirement of Nutiteq, a leader in SDK development for all mobile platforms, and our latest innovation, Deep Insights, for unprecedented big data analysis at any scale. In March, we want to continue to help you go further with location intelligence and CartoDB.
-
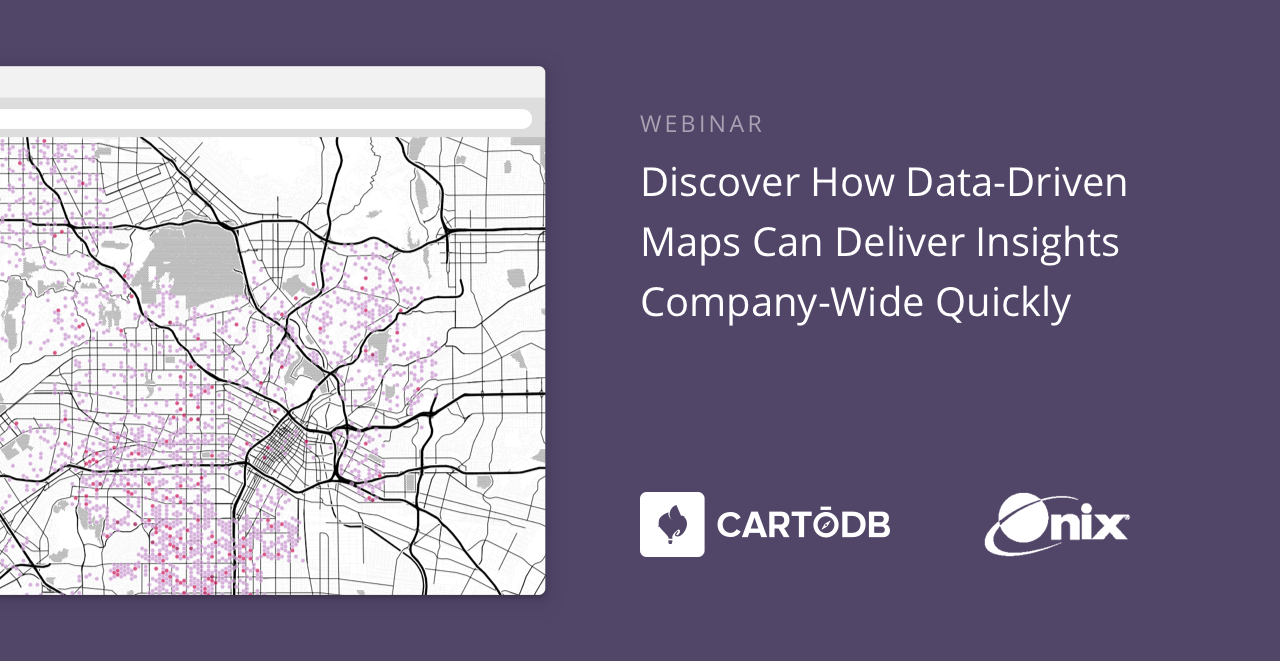
Onix is a leading provider of IT solutions and services to a broad range of government and corporate customers. Onix partners with location intelligence industry leaders such as CartoDB and offers extensive expertise in the design and implementation of end-to-end comprehensive IT solutions.
-
 Location intelligence is an often heard term, but what it means and how it can benefit businesses, institutions and individuals may not be immediately obvious. Location intelligence is more than analysis of geospatial information or geographic information systems alone, it is the capability to visualize spatial data to identify and analyze relationships. Evolving from GIS, location intelligence provides analytic and operational solutions across organizations.
How does all this data help people, and what about the customer or client? Organizations have discovered that data can be one of the best ways to get insights about customers and how to serve them better, increasing brand loyalty and improving customer relationship management. Linking customer addresses to a geographic area and then running these against internal company data and external demographics such as census data and income data, or other open data can provide unprecedented levels of detail. Who people are, what they do, and how and when they consume is tied to the where in essential ways. What is their neighborhood, commute, and workplace?
-
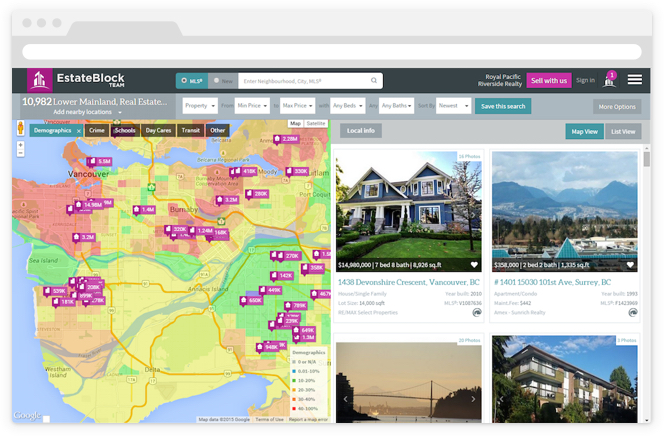
Rilos, a business-to-business consulting firm that provides solutions and site-location reports to real estate developers, commercial real estate consultants,
and retail data analysts, leverages location intelligence to provide innovative
and impactful insights for their industry! -
We absolutely love client success stories that make use of big data and provide great insights for customers all over the world. In this case, the insights are for one of the fastest growing global fields, real estate.
-
2016 is off to a great start! Now that we’re one month in, it is time to set the tone for the rest of the year and some of that planning and insight is best visualized. Some industries are already making the most our of data-driven visualizations and their business intelligence.
-
Real estate is a great sector to leverage deep insights using location intelligence. Properati, a property search portal with a strong presence in Latin America, aims to improve the experience of purchase, sale and rental of real estate. Currently the site operates in Argentina, Brazil, Chile, Mexico, and Colombia with over one million properties listed.
-
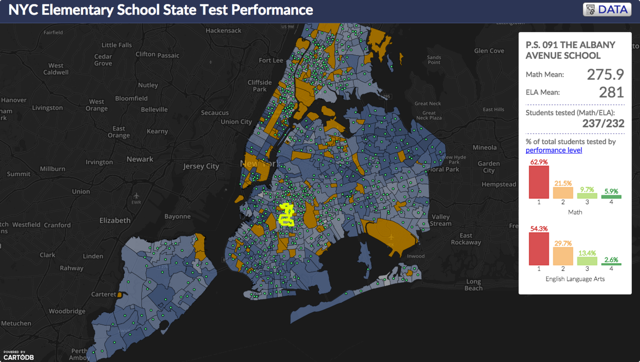
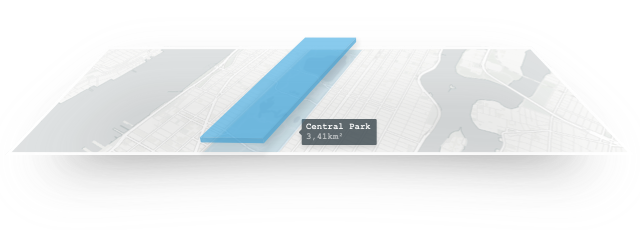
Many universities around the world use CartoDB, for research and in the classroom, to create interactive tools for educators and departments. Types of visualizations vary from historical occurrences, natural events, predictions, economic trends, population performance, and disease evolution.
View how test scores are visualized per school district in polygons to show elementary school student performance in New York City.
-
Join CartoDB scientists Andy Eschbacher and Stuart Lynn, fellow geospatial data wranglers, and web cartographers at our Intermediate SQL workshop on Tuesday, January 12th!
-
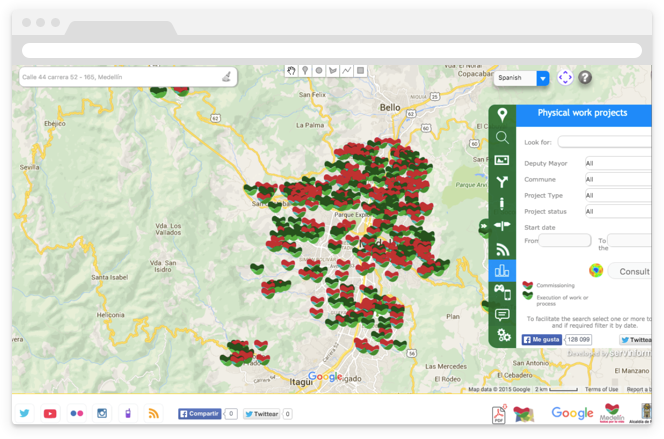
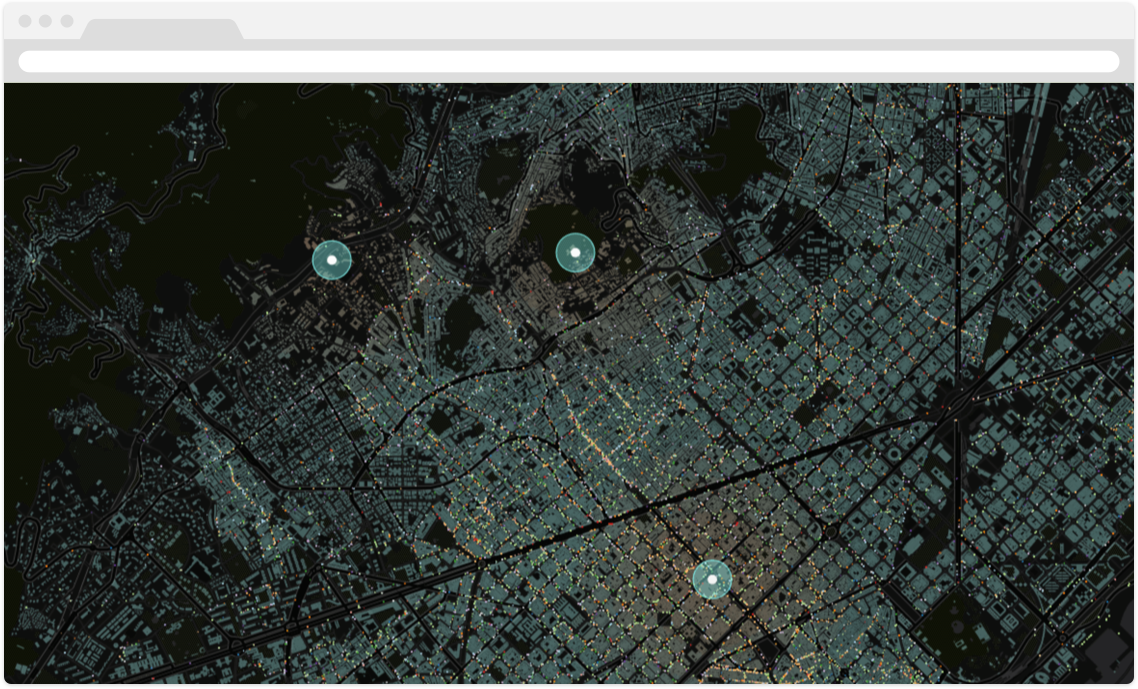
Location data is paramount to intelligent cities planning and development. Geographical information provides a common frame of reference and big picture analysis for entrepreneurs, citizens and policymakers alike.
-
Data-driven visualizations are a compelling method to engage audiences in some of the most unconventional ways. How exactly does charting the musical preferences of your global users turn into one of the most web trafficked visualizations on your platform?
Spotify, an award-winning digital music service, fused geographic analysis and user data to discover musical trends all around the world and increase brand awareness through a cost effective solution!
-

You don’t need a DeLorean to drive into the future of big data. Join Sergio Alvarez at El País con Tu Futuro in Madrid, where he is giving a talk titled
Back to the Future on Thursday, December 17. -
Our very concept of place is shifting as digital information layers and enriches the physical world. The streams of digital data generated by our daily lives tell stories and offer rich context and insights. Location intelligence offers views into our environment that has become encoded with new meaning and messages.
-
The ideal intelligent city model is one where technology and data serves the goal of improved standards of living, sustainable use of resources and pollution reduction. And location data has a critical role to play in getting there.
For officials and citizens looking at planning and metrics for water, traffic management, lighting and construction, integration of information from city departments is necessary. Data must be presented in accessible formats for efficient management and response times.
-

We are happy to announce our new CartoDB Ambassadors page — we want to reward our our influential mappers for all their great work in CartoDB! As an Ambagitssador mapper, you will be able to display a portfolio of maps on our site, with increased visibility in the mapping community. We will blog about your projects, and share them throughout the CartoDB community.
-

On December 1st, 2nd and 3rd, the Madrid Municipal Congress Centre will host one of the most important events in the digital sector in Spain, the International Digital Content Forum (FICOD) 2015.
This year the attendees of the conference will be greeted with visualizations by CartoDB on a giant screen. CartoDB is proud to be hosting a booth at the event, along with talks and workshops — we hope to see you there!
-
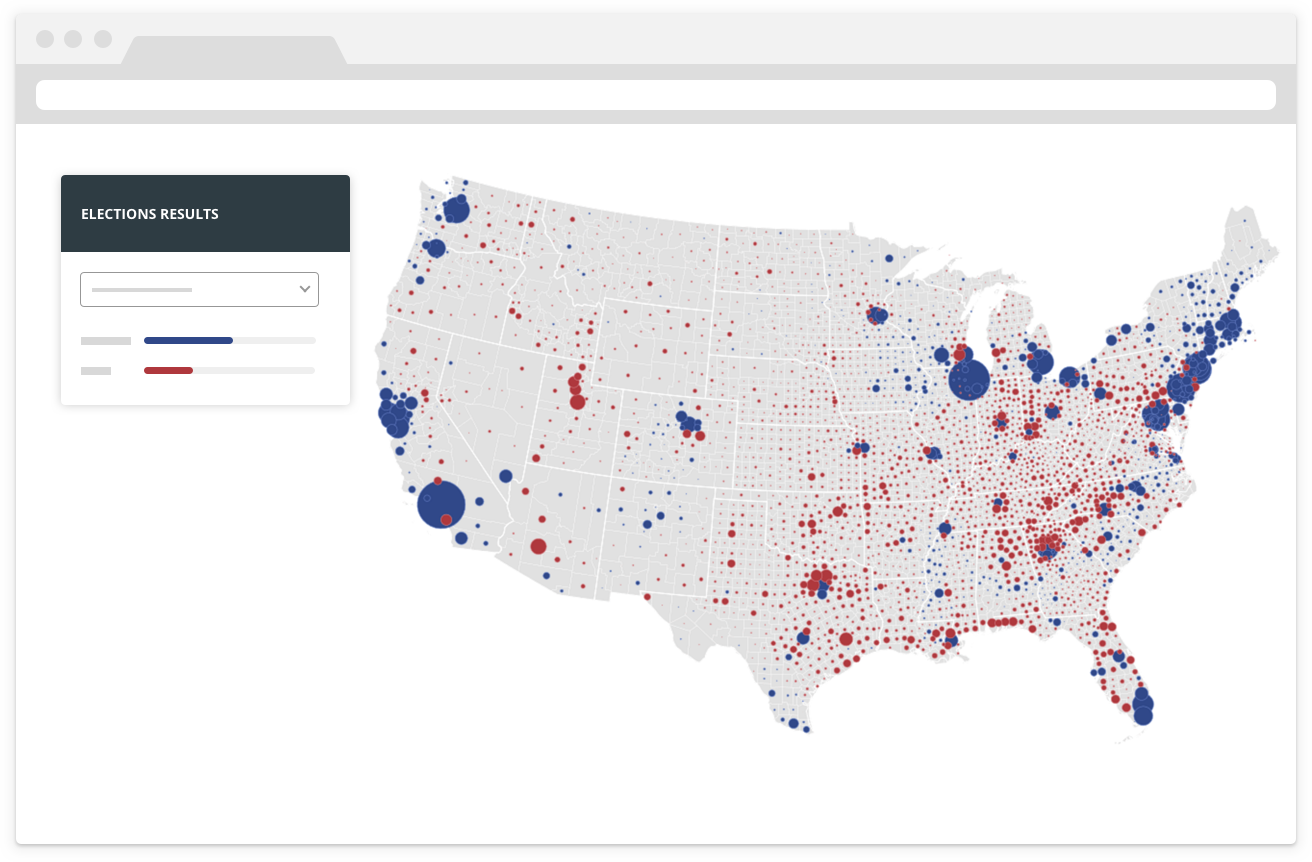
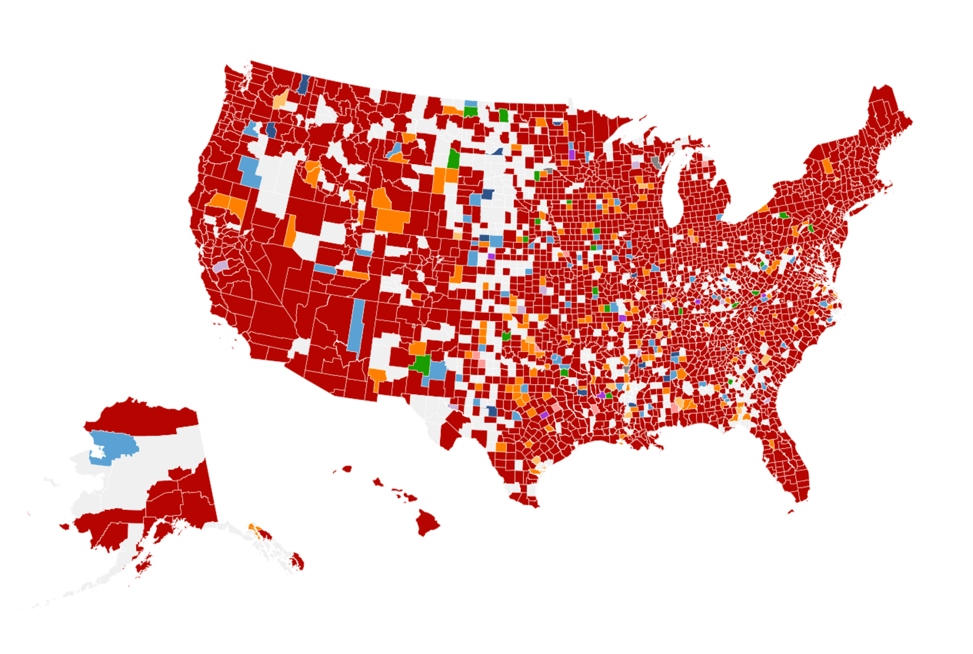
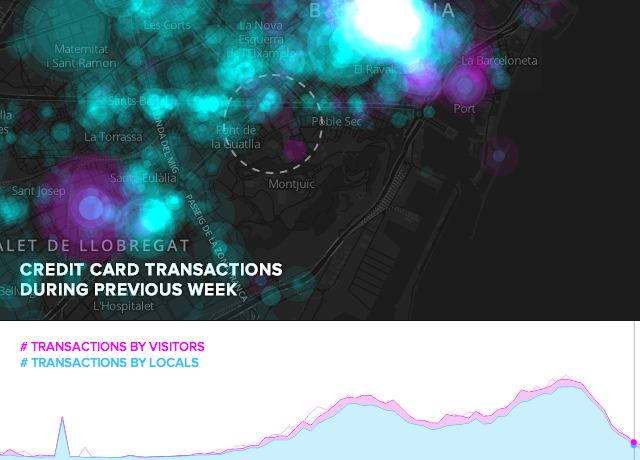
Election season is fast approaching! How can news outlets and media agencies set themselves apart from the rest of the articles on the campaign trail? Data-driven visualizations that’s how!
-

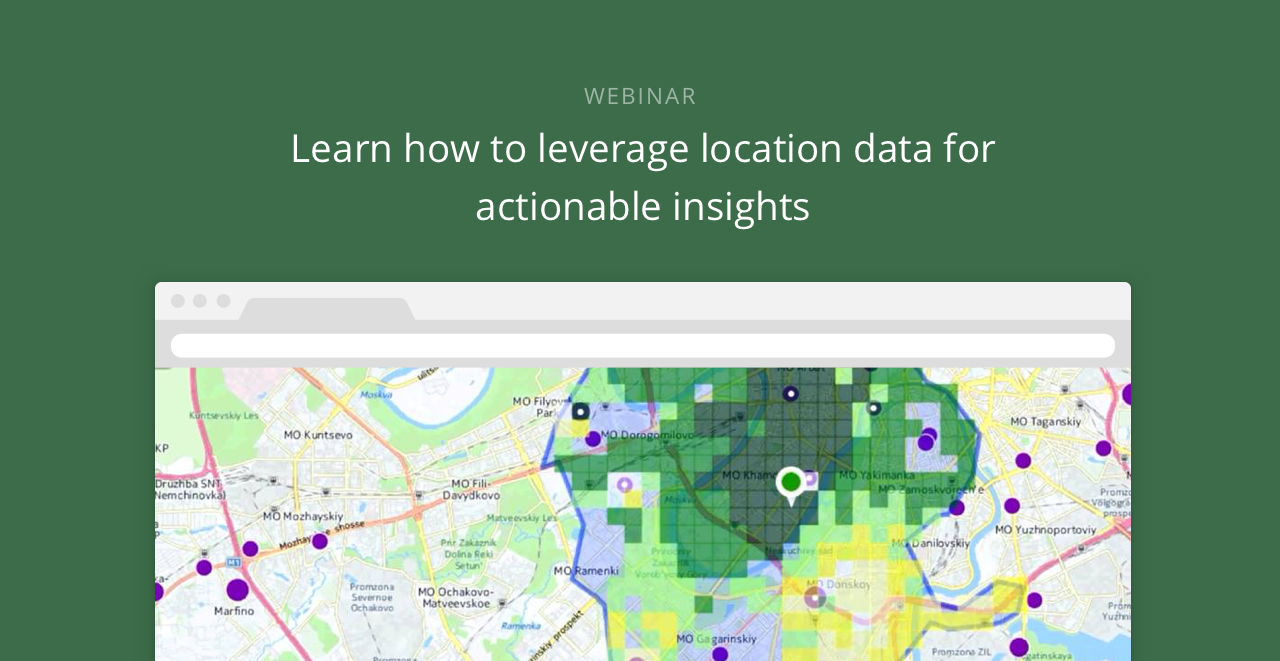
CartoDB is excited to announce a series of webinars designed to meet your industry specific needs.
From now to March 2016, we will host a once a month series of 45-minute webinars that are focused on various professional sectors. During these webinars, we will share with you all the relative visualizations related to the webinar topic, as well as give you tips about how to get the most out of CartoDB for your sector. We’ll also share with you resources that are useful in creating stunning data-driven visualizations.