Posts by: Eva Cabanach
-
How we view, collect, and process data has gone through a revolutionary transformation. Roughly 45 years ago, the most widely disseminated image of the Earth was captured by NASA, The Blue Marble. Eight years ago, smartphones were invented – forever changing the way we take images and store and collect data. Now, companies like CartoDB are ushering in the age of data analysis.
-
Every day large volumes of location data are generated by social networks, remote sensing, and mobile devices. For quite some time, Geographic Information Systems (GIS) has been used as the standard tool to manage and analyze this type of geo-referenced data. However, GIS tools have always been oriented towards professionals in geomatics than to the general public, creating a barrier to real insights and data analysis.
-
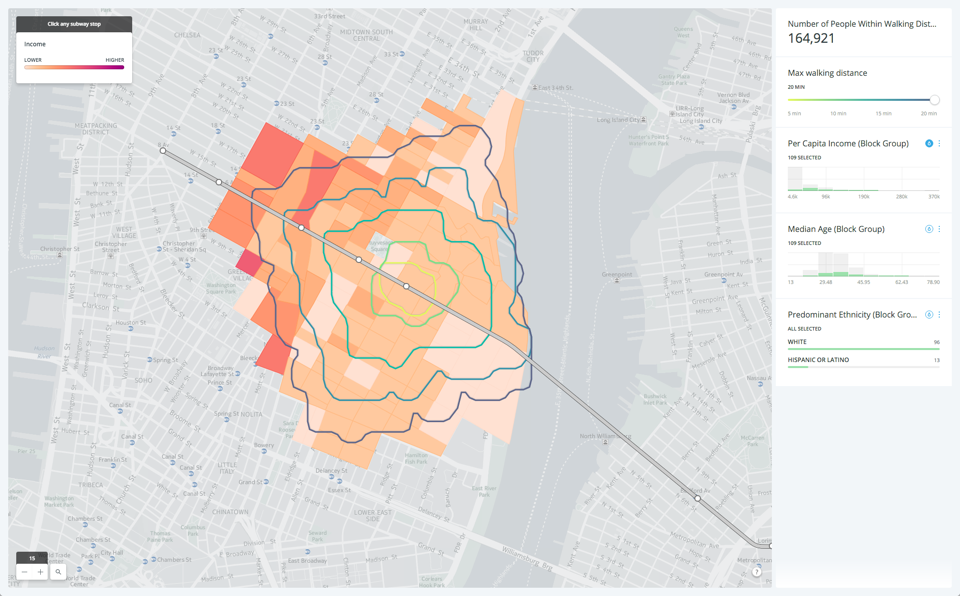
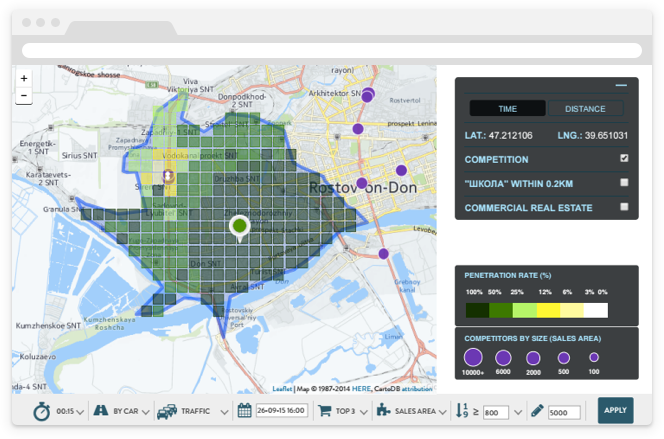
When calculating distances on maps, often we simply compute the ‘as the crow flies’ distance: the length of the straight line that links our origin and destination. For human-centric uses, this is rarely the correct approach as it ignores the fact that we cannot walk on water or pass through solid walls. Instead, we have to navigate among obstacles such as buildings and one-way streets. For many tactical business decisions, we need to use the distance someone would
actually have to walk or drive to get from A to B, which can dramatically change the results.To solve these problems, we introduce isolines. Isolines are a way of measuring how far a person could realistically go from a location in a given time with all the buildings, streets, and other obstacles in their way taken into account. Since they can go in many directions, the lines are the boundary of the surface of all possible end points.
-
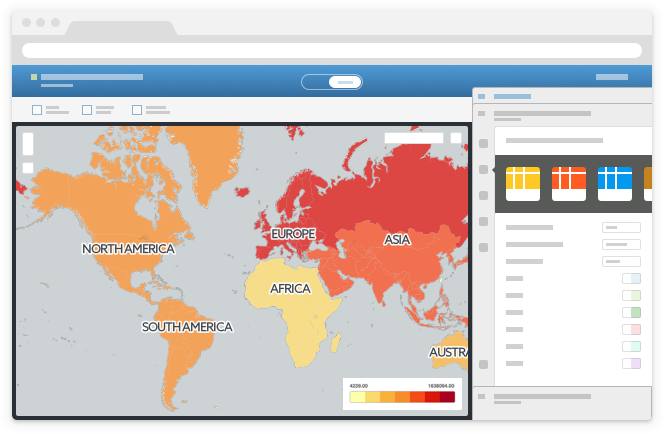
Welcome, CartoDB community, to Deep Insights—CartoDB’s solution to make the invisible visible, and allow you to discover unseen correlations and patterns at an unprecedented scale.
-

Mobile World Congress is fast approaching and we simply can’t wait to see all the great insights and hard work from the mobile community the world over.
-
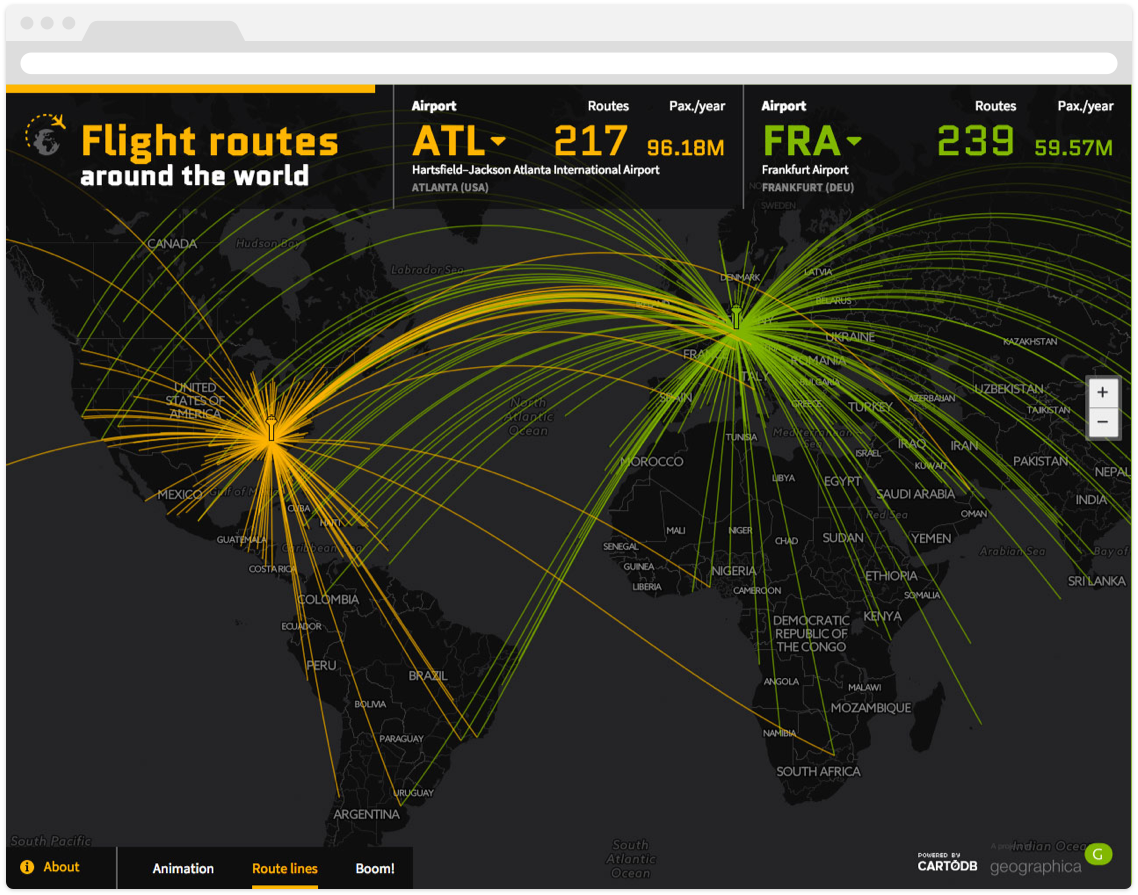 What’s the busiest airport in the United States? That simple question led Geographica on a path to insights and analyses of airports and flights all around the globe. Geographica specializes in software solutions to sort, analyze, and visualize data. Using CartoDB, they developed a data-driven visualization to derive insights on thousands of data points.
 -
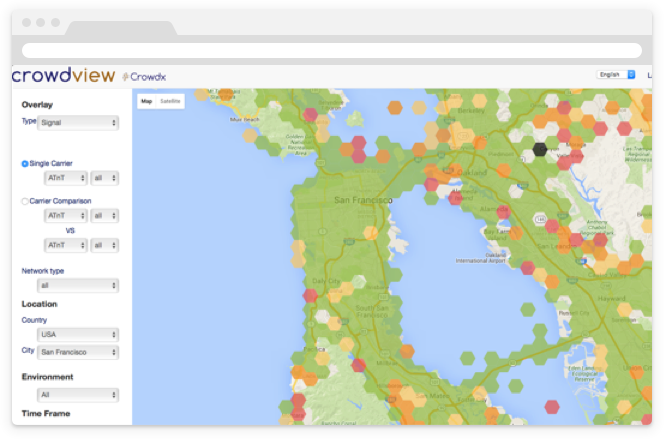
Wait… My call’s dropping… I think my phone is breaking up. Darn it! I’m not getting any wifi signals so all my iMessages are turning into green SMS texts instead of the placating blue. Many telecommunications agencies work relentlessly to provide solutions to many of these and other customer related problems.
-

Mobile World Congress 2016 is now just a month away! We are happy to participate again in the world’s largest conference for the mobile industry, organized by GSMA. This global event in the mobile tech industry will take place in Barcelona at Fira Gran Via from February 22-25.
-
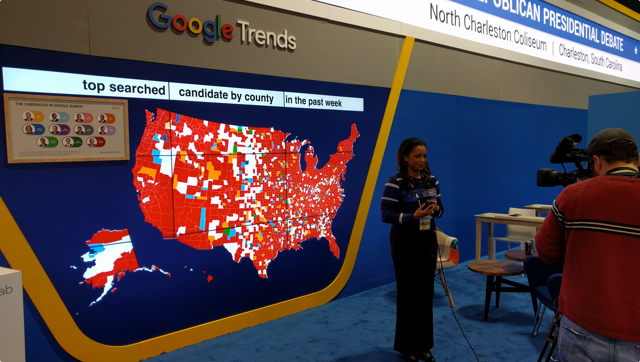
With less than a month away before the first U.S. presidential primaries, all eyes are on the headlines for the latest jabs by Trump, Hillary, and the gang. Just how do journalists get the spin on the topics and trends this election season?
-
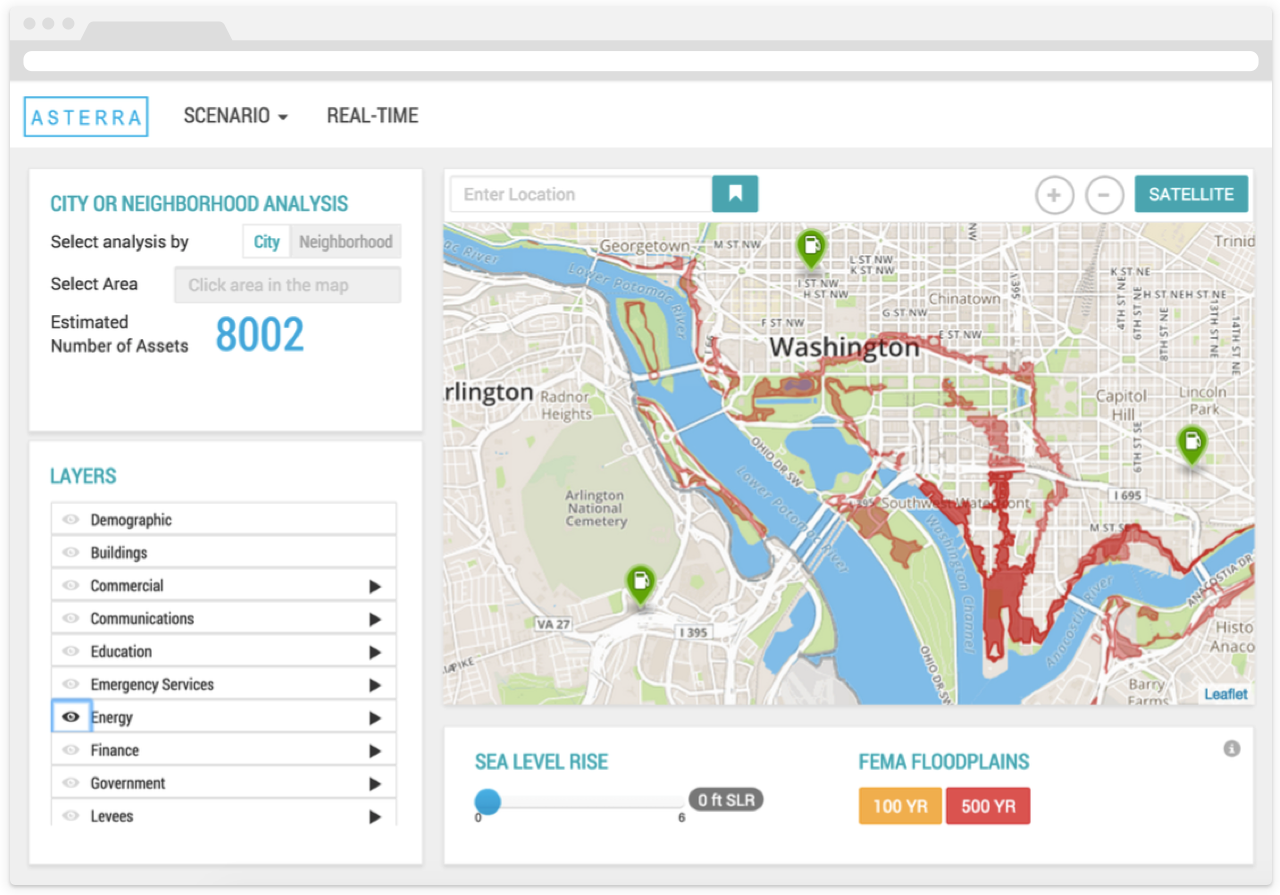
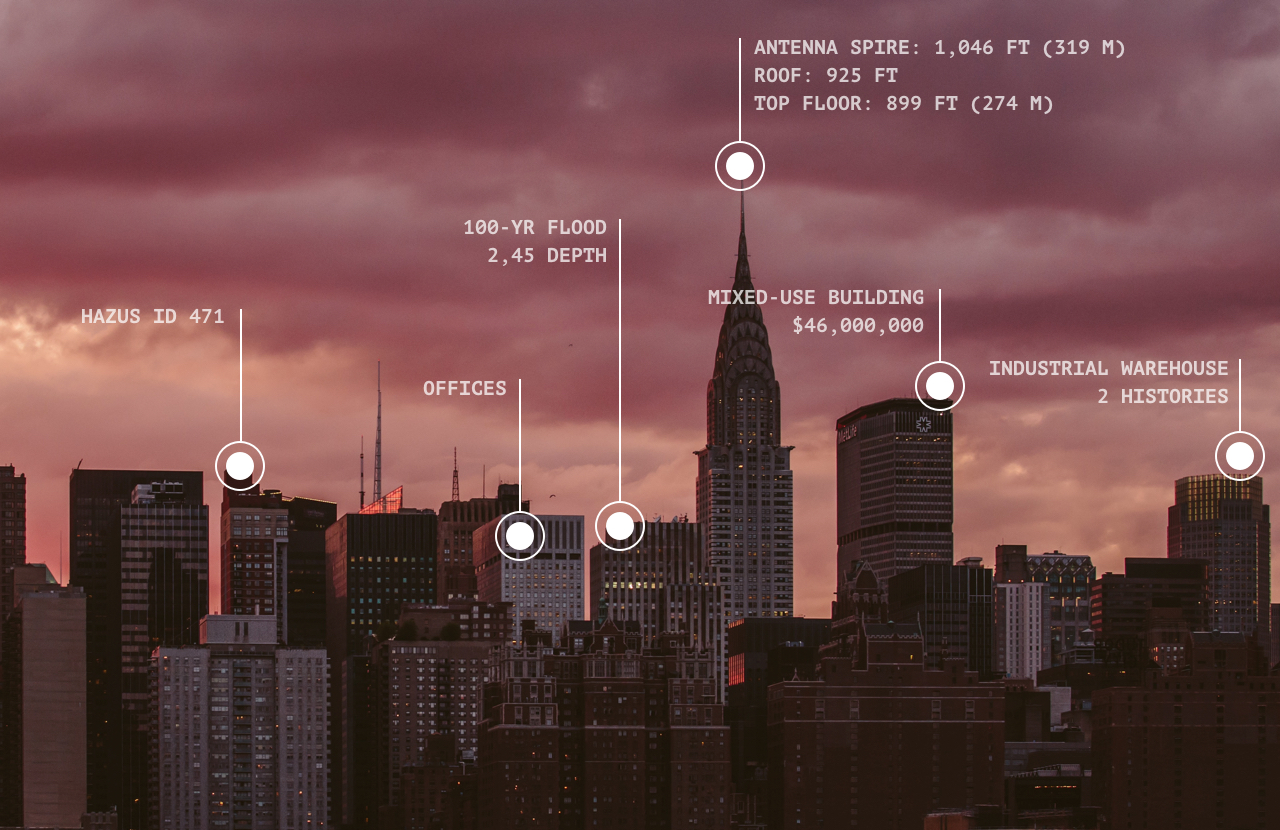
After COP21, it is expected that more and more cities will work towards implementing a solution to climate changes that have adverse affects on infrastructure and populations.
A CartoDB partner, Vizonomy, created a risk platform analysis dashboard, using open government data - for this specific reason. The dashboard allows communities and businesses to see infrastructure and populations vulnerable to a rise in sea level and flooding.
-
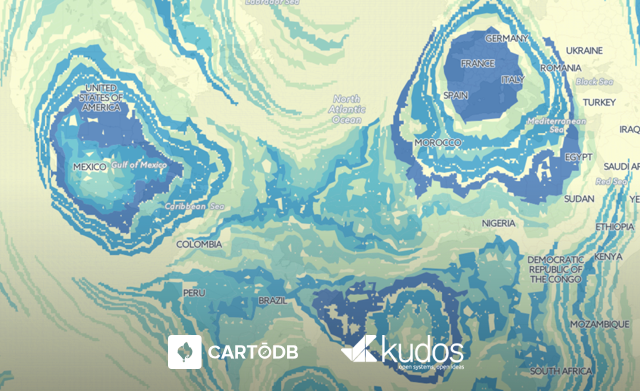
GKudos, a CartoDB partner, is a GIS visualizations firm that specializes in the management, analysis, and publication of geo-referenced information. One of their goals is to help customers have increased productivity and competitiveness through the use of information technology and telecommunications.
-

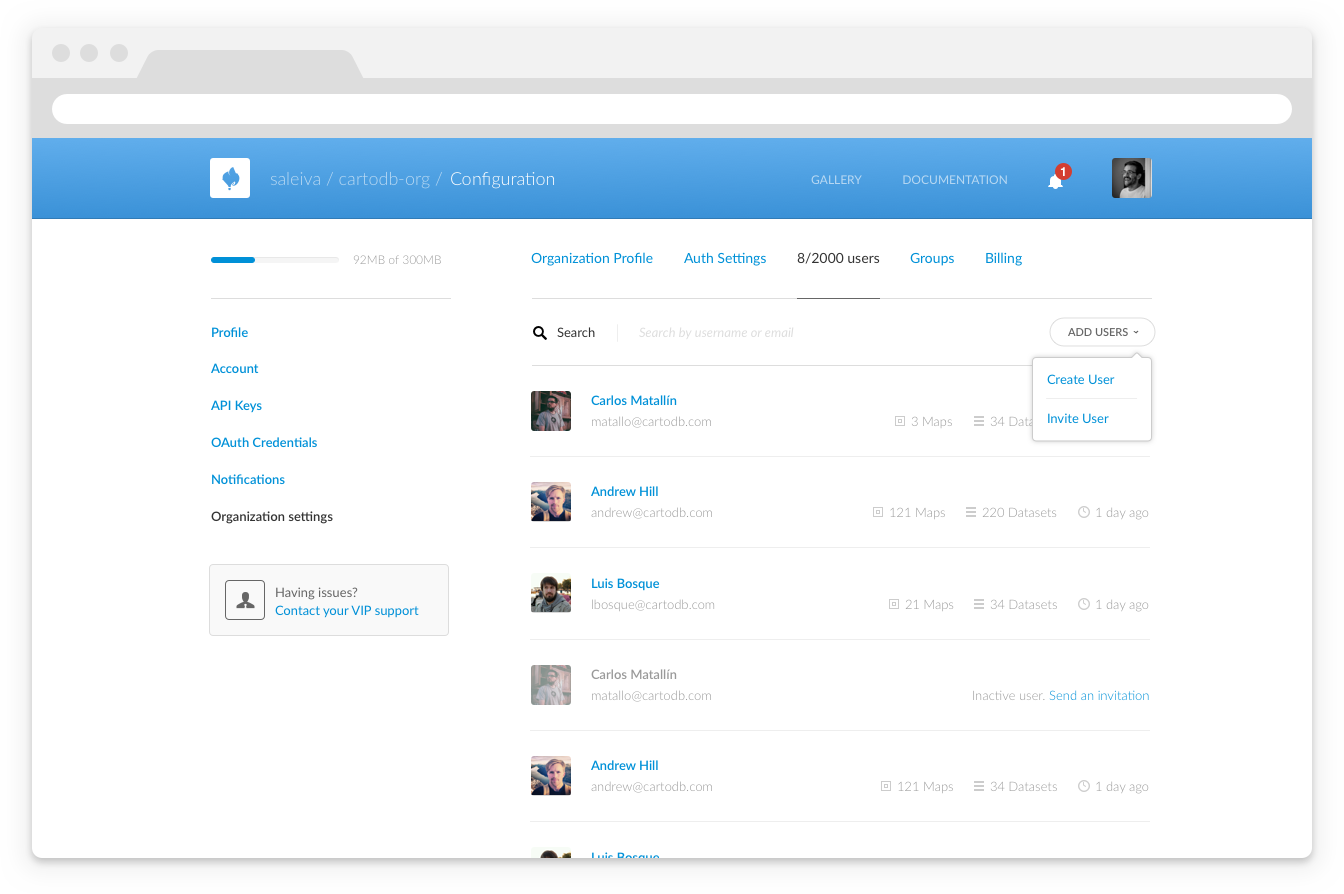
Organization owners are now able to manage users in their organization with our new Enterprise User Management API!
-

Last week’s Partner Summit was a smash hit! With representatives from more than 50 partner companies, ranging from small geo-consulting firms to large systems integrators to other SaaS businesses, this two-day event had all the right voices. Here’s a quick recap and some thoughts on the future.
-
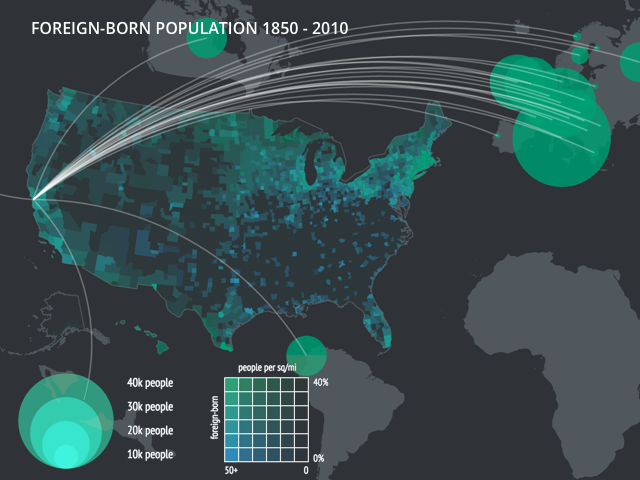
When Charles O. Paullin and John K. Wright created The Atlas of the Historical Geography of the United States in the 1930s, they made the best atlas they could given the tools at their disposal. Standing on the shoulders of giants, they could see further than this, and dreamed aloud that “the ideal historical atlas might well be a collection of motion-picture maps, if these could be displayed on the pages of a book without the paraphernalia of projector, reel and screen,” but didn’t have the technology to make it happen in the 1930s.
Today we have that technology. The University of Richmond’s Digital Scholarship Lab and Stamen Design, with the support of Andrew W Mellon Foundation, have launched a new project, called American Panorama, that aims to realize that vision of the “ideal historical atlas”. American Panorama includes a new suite of data visualization tools for students, scholars and researchers to easily create data-rich, interactive maps of change over time and space.
-
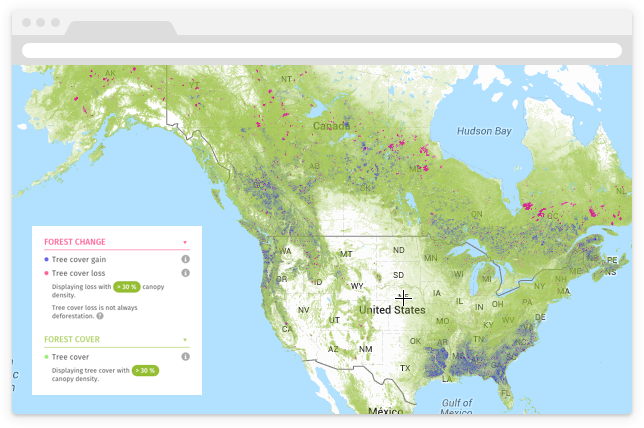
Planet Labs, Github, Vizzuality and CartoDB, have come together to use #LoveEarth to motivate communities on Facebook and Instagram and, to amplify the social movement around global climate change and the Paris Climate Summit - COP21, which will be convening leaders from all around the world.
-
Lewis and Clark. Armstrong and Aldrin. Williams and… Williams? If you’re going to achieve great things, it’s imperative that you pick the right partner. Someone you can trust, and who offers talent and vision.
-

All over the world, tech giants and startups are reshaping the future of the digital economy. There is no doubt that the web is changing the way we do business. More and more, what happens in the digital space will affect how and what
we consume. -
What are smart cities? A catchy phrase or a real movement for change, or something in-between? It is true that the challenges facing cities are real: aging infrastructure, rapid development, climate change, and populations growing at unprecedented rates. To keep pace, future cities must be more agile and inclusive. City agencies are looking to do more with less, and to do it more efficiently. Cities have become testing grounds for tech innovation, and increasingly citizens are leading the process or collaborating directly with
city agencies. -

CartoDB recently moved to an amazing new office in Bushwick, Brooklyn. With over 25 employees, we were bursting at the seams in our Williamsburg office and needed to find a spot that would allow our team to expand into our
next phase. -
Sharing insights with your peers and colleagues just got easier. CartoDB now permits organization administrators to set up user groups to share data-driven visualizations and datasets with our permissions management system.
-

In the ever changing and rapidly growing ecosystems that define cities, the CartoDB platform has become imperative in enabling citizens, city agencies, and private industries to implement easily adaptable, real time enabled, and analytically robust data driven solutions.
-
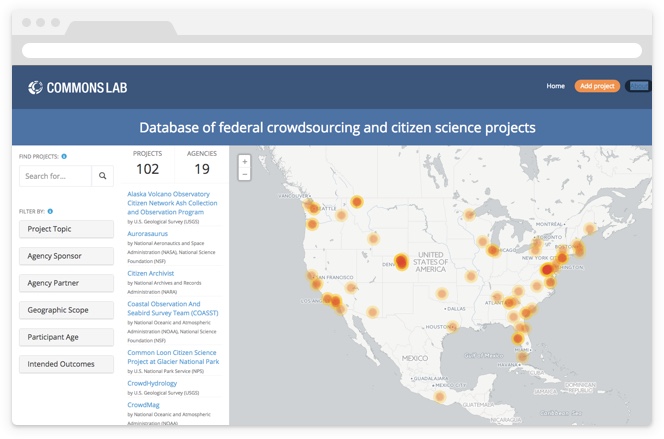
Amidst the growing number of civically engaged public events, federally led hackathons, and public development projects, the question has arisen, where can all these projects and information sources be consolidated?
-

Looking for a digital service that offers an understanding of data complexity that leads to smart decisions, that make people’s lives easier? Looking for a conference that can offer all these things too?
-
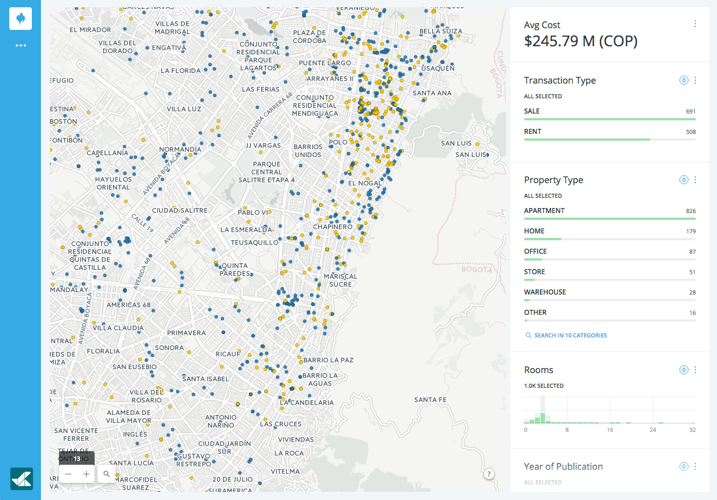
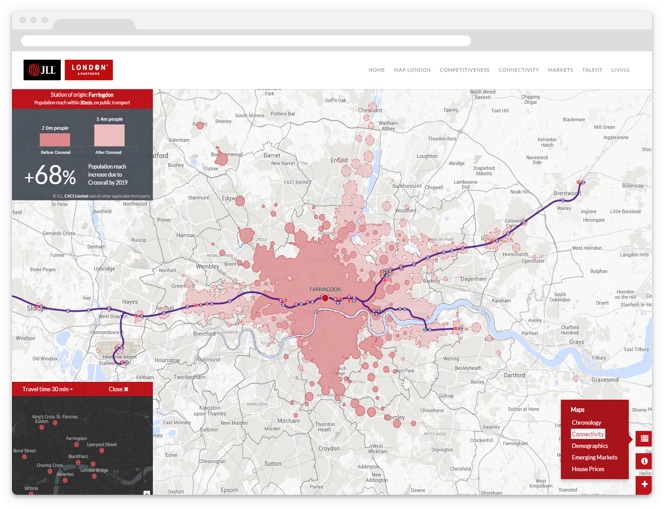
Businesses and real estate agencies can save time and money by adding spatial analytics to their intelligence systems. Location analysis can provide insights that support and improve decision making from marketing to supply chain logistics and operations. Rilos, an international business-to-business company, fused business intelligence and geographic analysis to discover powerful new insights. Now that’s location intelligence.
-
At CartoDB we listen to what our users need and want. We are constantly brainstorming and coming up with new ideas, but it is always the very best in user experience that we hope to deliver. This month we’ve launched two brand new sections on our website: Explore and /me!
Visit Explore to see the top trendy maps of the day. The new explore section allows users to browse the most popular public CartoDB data-driven visualizations. Now you can see the top 10 maps from all CartoDB users based on three criteria: likes, views, and date. You can also filter your list by “maps”, “datasets”, or “maps and datasets”! Additionally, you can order visualizations by most ‘likes’ and views.
-
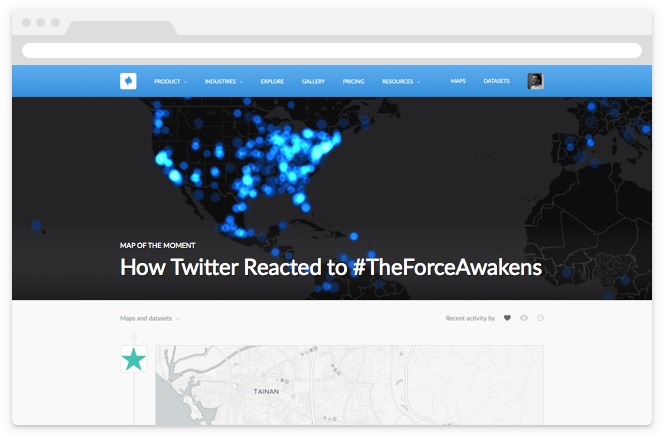
From real estate and government organizations, to the financial sector—location intelligence is used by many industries to uncover a myriad of insights in big data. Media and Creative agencies can also harness the power of insight and uncover many secrets through a great data-driven visualization for increased brand engagement and international exposure.
-

Howdy Mappers! CartoDB is happy to be a platinum sponsor of the Texas GIS Forum, the state’s premier conference for the geospatial professional community.
-
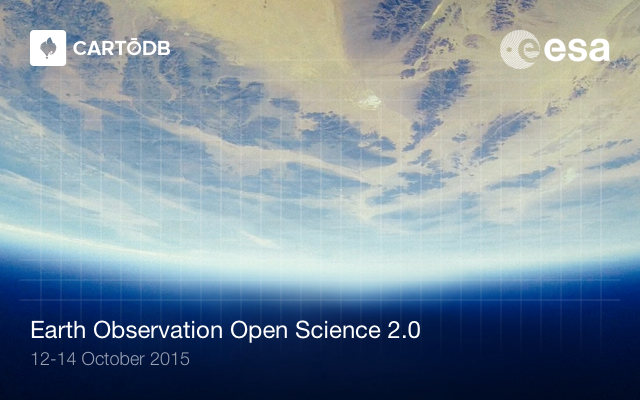
With the recent discovery of water on Mars, what better time than now to think of fresh new ways of space exploration and data visualization, as well as how we view the third rock from the sun?
-
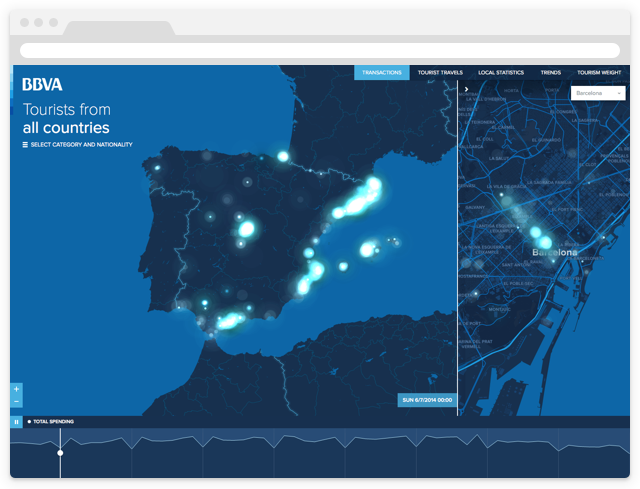
Spain is the number one tourism country in the world. With sights like the Museo del Prado and Royal Palace of Madrid, it is hard not to see how such spectacular beauty could ever be overlooked.
To assist in visualizing the majesty of this European gem, Vizzuality and CartoDB are proud to announce our latest release: an interactive tool to analyze tourist spending in Spain during the summer of 2014. Using BBVA Data and Analytics, you can see how tourists of different nationalities spent their time in Spain. Take a look at this UN-BBVA-LIEVABLE visualization and welcome guest blogger, Jamie Gibson from Vizzuality!
-
Real estate is an industry that relies heavily on data-driven insights and visualizations. Agencies, listing services, property departments all choose CartoDB to visualize their business and make insightful decisions.
-
Qlik Sense users no longer have to rely on just the classic way of visualizing important decisions. Now in addition to graphs, pie charts, and other visual analytics, Qlik Sense users can use CartoDB’s slick Torque animated maps as well as additional visualization renderings. CartoDB for Qlik enables the creation of data-driven maps to visualize location data within the Qlik Sense Dashboard, which is personalized to maximize analytics to get the most impact and insights from your data.
-

The City of Las Vegas goes by many names: Sin City, the City of Lights - but this month it will take a new name - Data Metropolis! A whole new world of opportunity exists in your data and for three days, over 150 sessions, with 4000 Splunk enthusiasts you can raise the stakes. There are no limits to what you can do with the massive streams of machine data generated by your business systems and technology infrastructure. Enhance your knowledge of data-driven products and apps with an ace up your sleeve, and solve your most important data challenges. We’re going to Vegas, baby!
-

The fall season provides a lot of fresh starts for many. The heat of summer and laxity subside as school semesters commence and vacations wind down. With these endings come new beginnings and the time for civic engagement has never been more rife.
-

Join CartoDB, from September 15 - 17, as we immerse ourselves in the historic city of Stuttgart, Germany at the INTERGEO Conference and Trade Fair. We will spend three days engrossed in geodesy, geoinformation, land management, and cartography. INTERGEO has special space in the hearts of map scientist and offers extraordinary insights on open source GEO.
-

Seoul, South Korea, the world’s most wired and number one ranked tech ready city is hosting one of the largest global gatherings focused on open source geospatial solutions. Next week CartoDB is attending FOSS4G for the second consecutive year.
-
CartoDB began with just a dream and soon, we’ll put miles under our wings (or elephant ears) and cross the United States to experience the power of that vision. Our CEO Javier de la Torre, along with VP of Sales Alon Vernikov and EMEA Sales Director Jaime de Mora, will be attending Dreamforce in San Francisco from September 15-18.

-
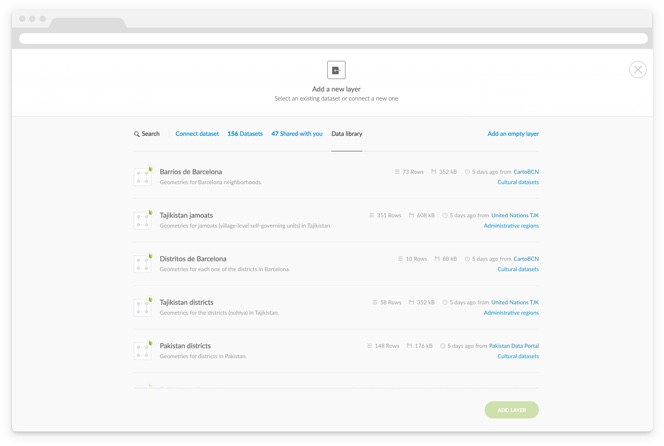
You’ve surely noticed that we’ve redone some parts of the web app to support some of our new features, so that creating maps is now easier, faster, and more straightforward than ever. As part of these improvements we’ve rebuilt the way you are able to add layers to your maps.
-

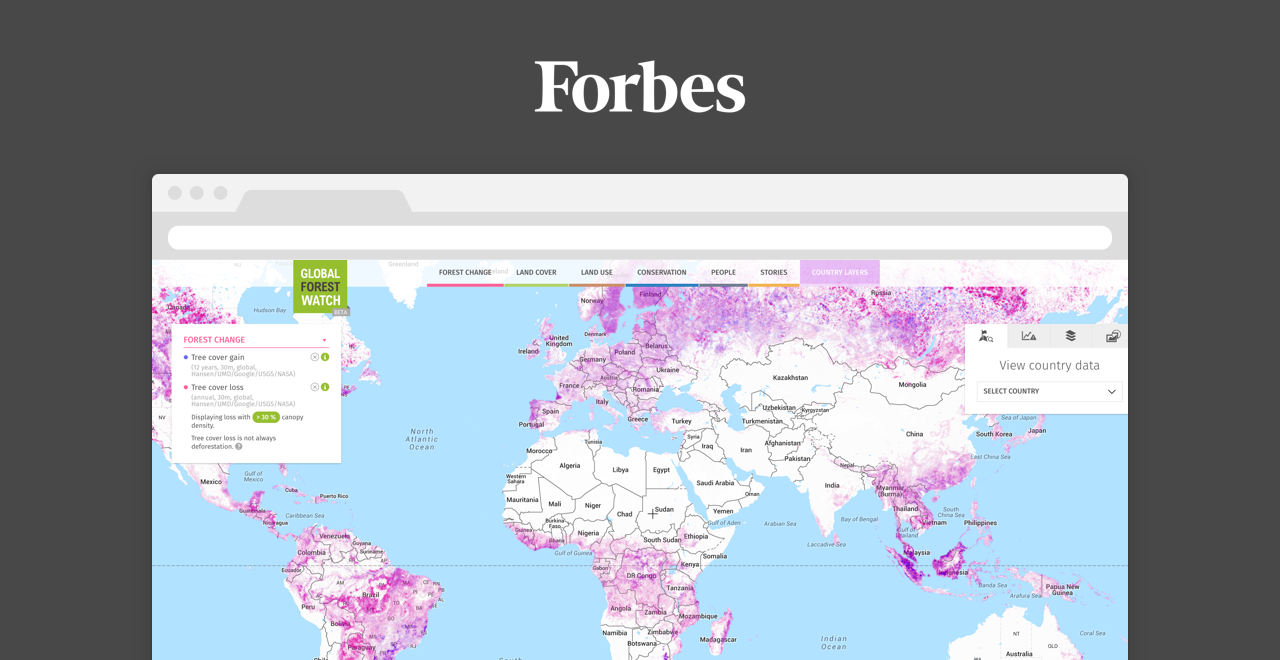
Words have never looked so beautiful before. When using CartoDB turn plain text into stunning visualizations that capture the minds and eyes of your readers. More than 80 media channels use CartoDB to visualize stories all around the world. From The Washington Post, Wall Street Journal, and Los Angeles Times — CartoDB’s visualizations make insights easier to understand.
-

As summer turns to fall, BBQ and lemonade gives way to packed lunches and cafeteria delights. But back-to-school stays cool with CartoDB’s Education Whitepaper. Ready to elevate your classroom lectures and group projects, CartoDB’s Education Whitepaper provides solutions for map-based data visualization, analysis, and storytelling - with no coding skills required.
-

Once a year the worlds of tech and music converge in a celebration of all things cool, hip, and innovative. South by Southwest is one of the most important tech events in the United States. Last year, this popular festival received more than 3,500 entries - making panel selection a really competitive process.
It is with great pleasure that CartoDB announces our three submitted panels for SXSW Interactive PanelPicker!
-
International Geomatics Week 2015 will take place in Bogotá’s Whyndam Hotel from August 10 - 14, 2015 as part of the Agustín Codazzi Geographical Institute’s 80th anniversary celebrations. The event’s focus is “Geospatial Information for Peacebuilding,” and will consist of talks, workshops, and networking events about innovative cloud-based geospatial technologies, and their applications in the public and private sectors.
Innovation, new technologies, and all things cloud-related are at the very core of CartoDB, so we couldn’t miss this event! Our very own Javier de la Torre will be delivering a keynote on the next generation of geospatial platforms at 9:15 on Tuesday August 11, and hosting a workshop about CartoDB and QGIS on Thursday, August 13. Browse through the full schedule here.

-
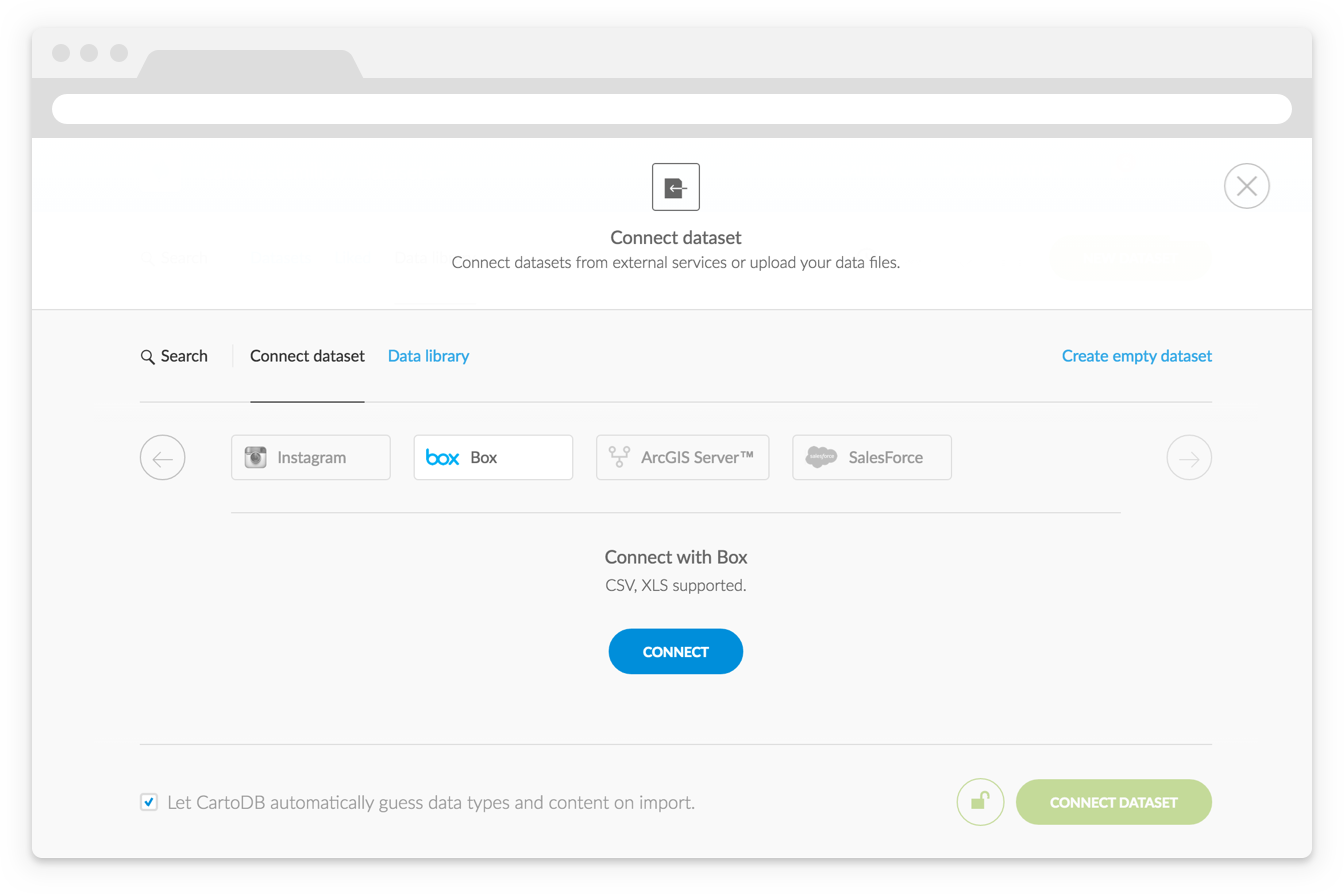
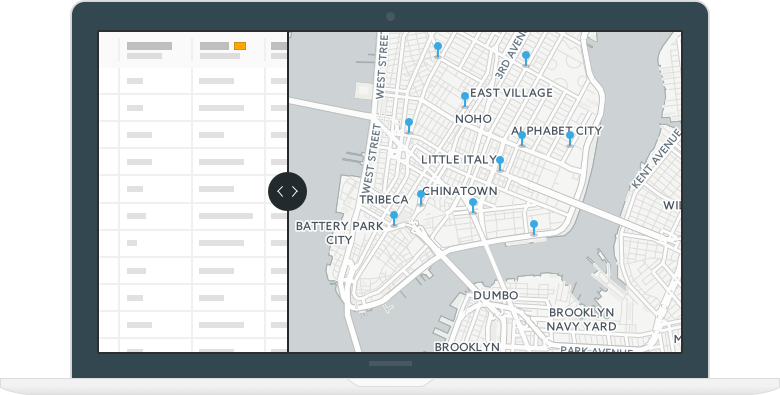
Sometimes datasets don’t contain any geospatial columns, but they have names, IP addresses, zip codes, or other information that can be translated into coordinates. CartoDB is able to assist you with this type of data.
-
Remember the days before cell phones, when you used to have to wait around at home to take a call? Or when the only way you could buy books, groceries, and clothes was by physically going to a store? Or when you had to select the best way to visualize your data on a map by clicking through various options yourself? No more.
-
One of the biggest challenges of the 2008 global financial crisis was the inability for financial institutions to handle risk management in a rapidly changing demographic. For businesses to progress post-crisis, re-imagining business intelligence and bringing their companies up-to-date with new technology became an imperative. CartoDB’s financial risk analysis has proposed the best solutions for meeting the needs of financial instutions to handle risks arising from rapidly changing client and customer demographics.

-
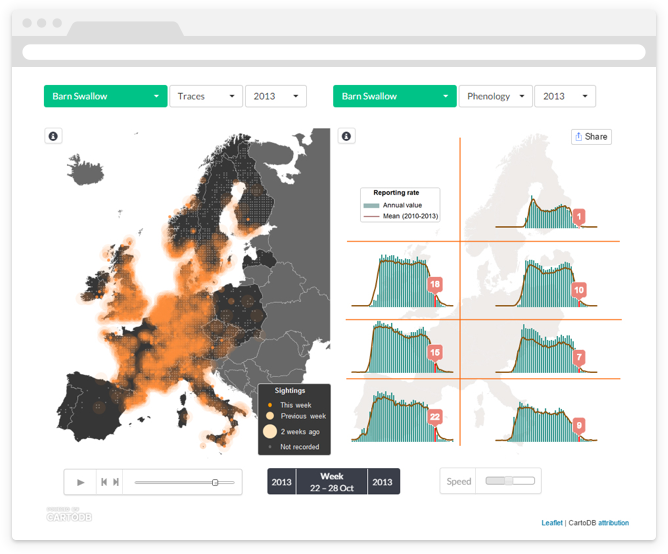
The EuroBirdPortal project is launching on June 5th in support of Europe’s Green Week 2015. The EBP project tackles the important task of ornithological research and conservation by developing a viewer that tracks various bird distributional patterns built with CartoDB.
-
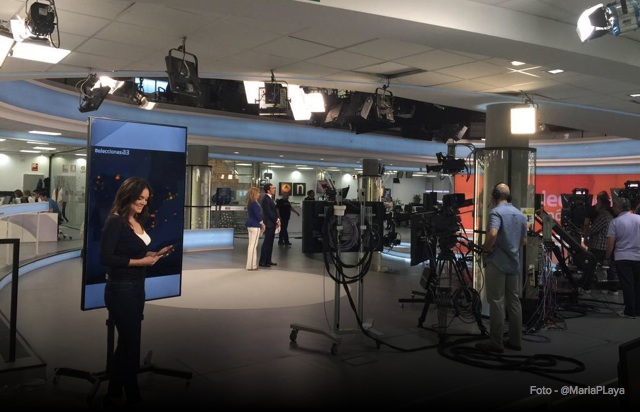
This past Sunday was election time again in Spain. Every four years people head to the polls for a regional and municipal election that often foreshadows what is to come in the national election held later in the year. Nowadays these events are considered much more than mere voting—they’re true milestones in the story of a nation and generate huge amounts of data powered by media outlets and social media networks.
Against this backdrop maps are not only a way to show voting results, political differences between regions, and possible political coalitions, but also a dynamic & interactive tool to visualize and analyze poll predictions and real-time results. We’re proud to have been chosen by some of the most important Spanish media outlets to create election coverage maps, and are excited to share them with you. Please keep reading to explore the different projects we were working on over the weekend, and to see the evolution of the Spain’s political map!
-

CartoDB is open by definition, so it’s about time we let you in on which one of the public maps you made is the most popular one at the moment. As you may be aware of, we at CartoDB love to challenge ourselves and experiment with different ideas that may end up leading to new endeavours. That’s what we do every Friday afternoon in our leapfrog sessions: team up to work on cool projects that aren’t part of our day-to-day tasks.
In one of this sessions a group of us came up with the idea of showing off the most-visited CartoDB map in an accessible and user-friendly way. That’s how the TrendMap idea was born and developed, and now we want to share it with everyone! If you’ve you ever wondered which CartoDB map is the most popular in real time, the TrendMap application is perfect for you.
-
On May 13, 2015 from 10 a.m. - 11 a.m., CartoDB will participate and host a session of NewCo at the CartoDB Brooklyn Office - 143 Roebling Street, 2A. Chief Science Officer Andrew Hill will present on the mastery of visualization and location and how emerging geo-technology platforms and tools are changing the way we see and understand the world around us.
-
It’s time to get that marketing data analysis monkey off your back, and CartoDB is glad to help! We are excited to introduce the new MailChimp Connector, a feature that melds our mutual love of efficiency and awesome geospatial visualizations with the data captured by a leading Email Server Provider.

-
CartoDB is very honored to announce that we’ve been nominated for a Webby! How do you say thank you in five words or less?
-

Next Wednesday, April 15th, we’re hosting a new edition of CartoDBeers - the informal gathering where we talk about maps, tech, and latest news. This time we are proud to welcome our very own Paul Ramsey, who will be presenting ‘Magical PostGIS in three brief movements.’