Category: Data
-
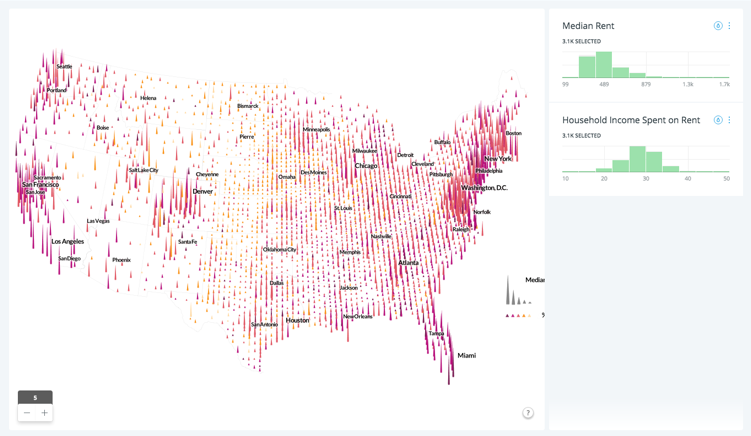
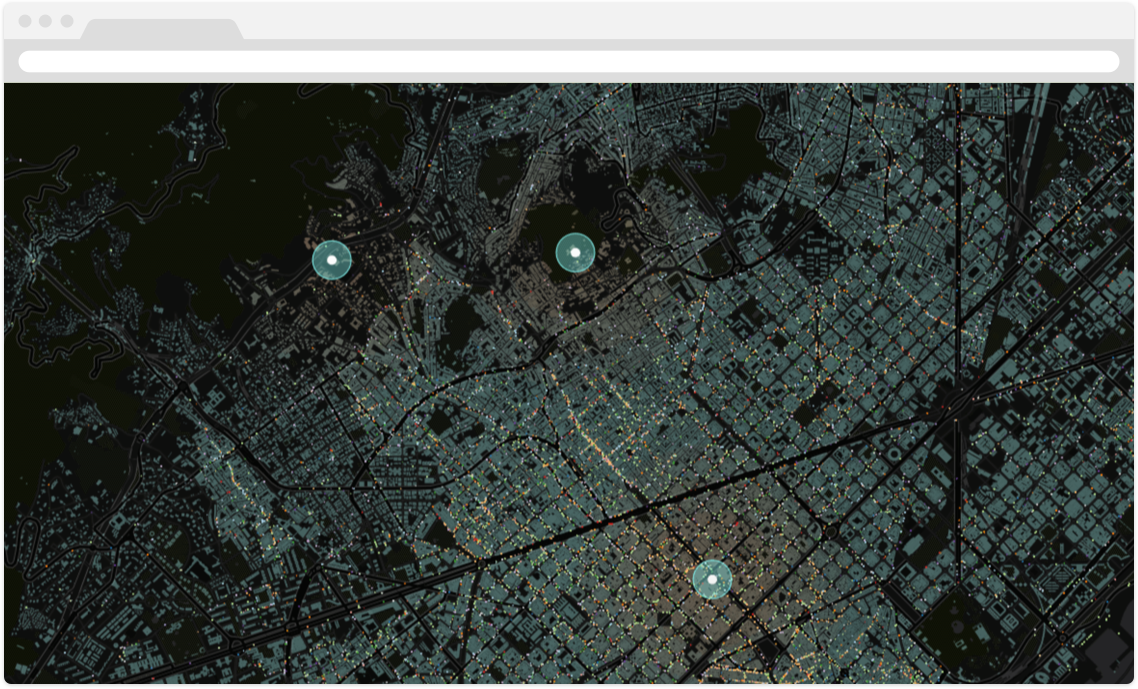
Lately, there has been a lot happening at CartoDB related to the visual exploration of location data. We’ve been researching, for quite a while, new ideas for visualizing thematic information on the web. Apart from color, we might have something to share with you soon, we are investing time experimenting with different methods for symbolizing data, and a set of tools to drill-down into other (non-visual) attributes of the data.
-
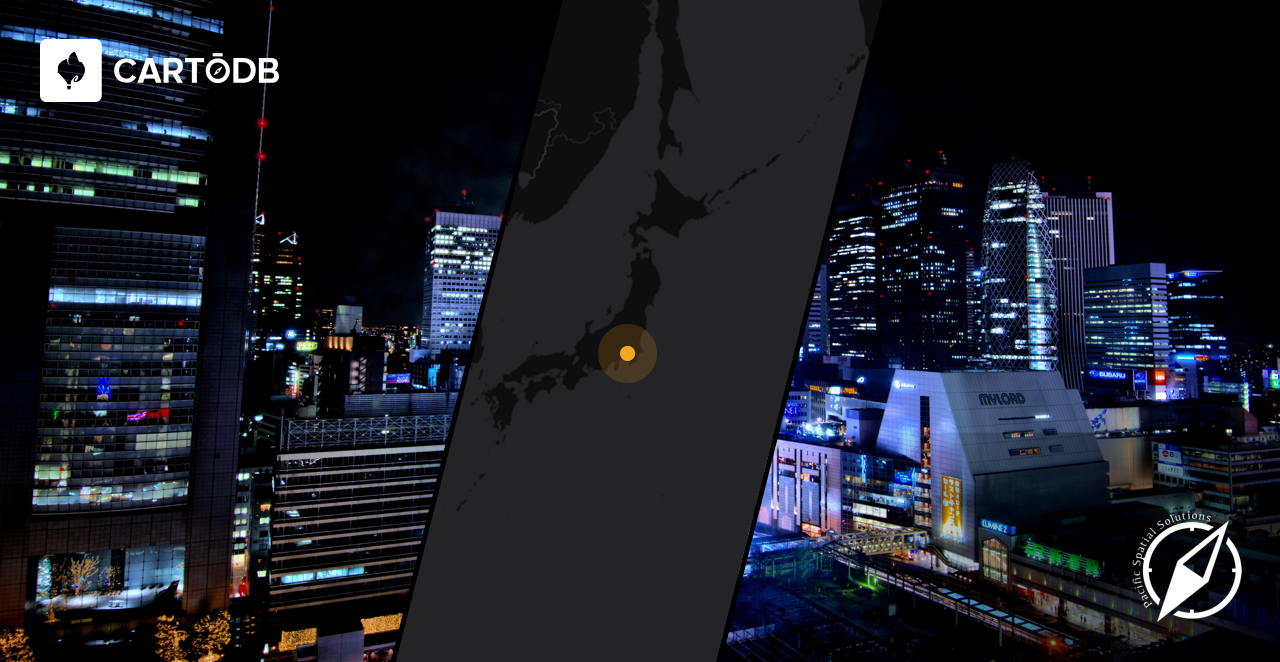
We are very excited to share details on our upcoming trip to Tokyo, organized together with OSGeo Japan and Pacific Spatial Solutions. Javier de la Torre and Jaime de Mora will be there for a week full of events and meetings.
-
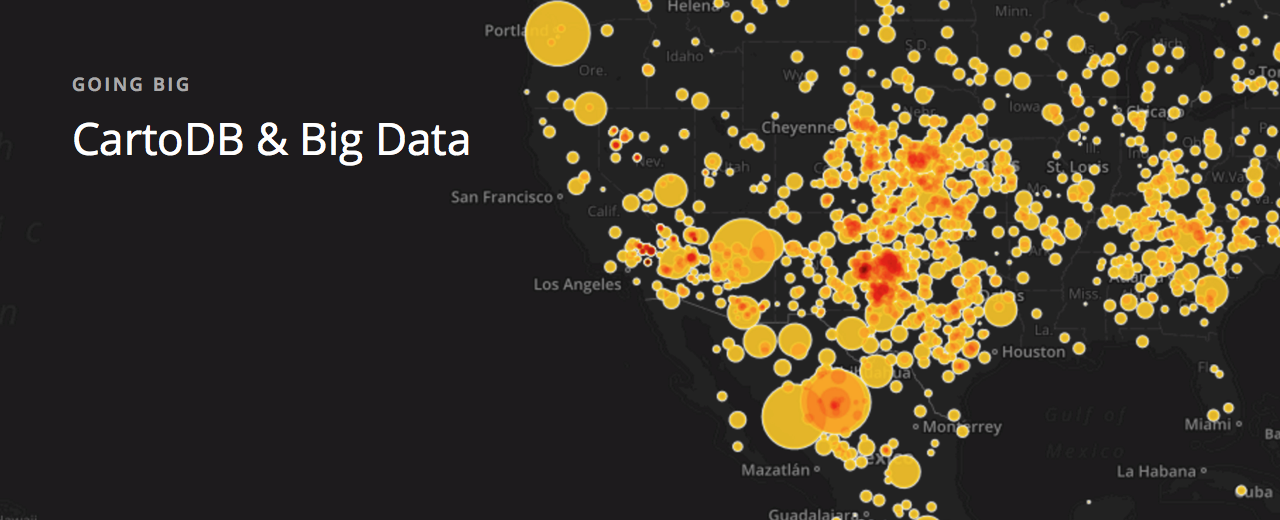
As we announced last week, today is the first day of Big Data week at CartoDB!
How can we begin to better understand and explain what big data is? Everyday we read in newspapers and social media the words ‘big data’ as it applies to businesses and systems of analysis and data aggregation. While it may seem like a marketing ploy, a critical approach to understanding what exactly big data is can provide new meaning to business intelligence.
-
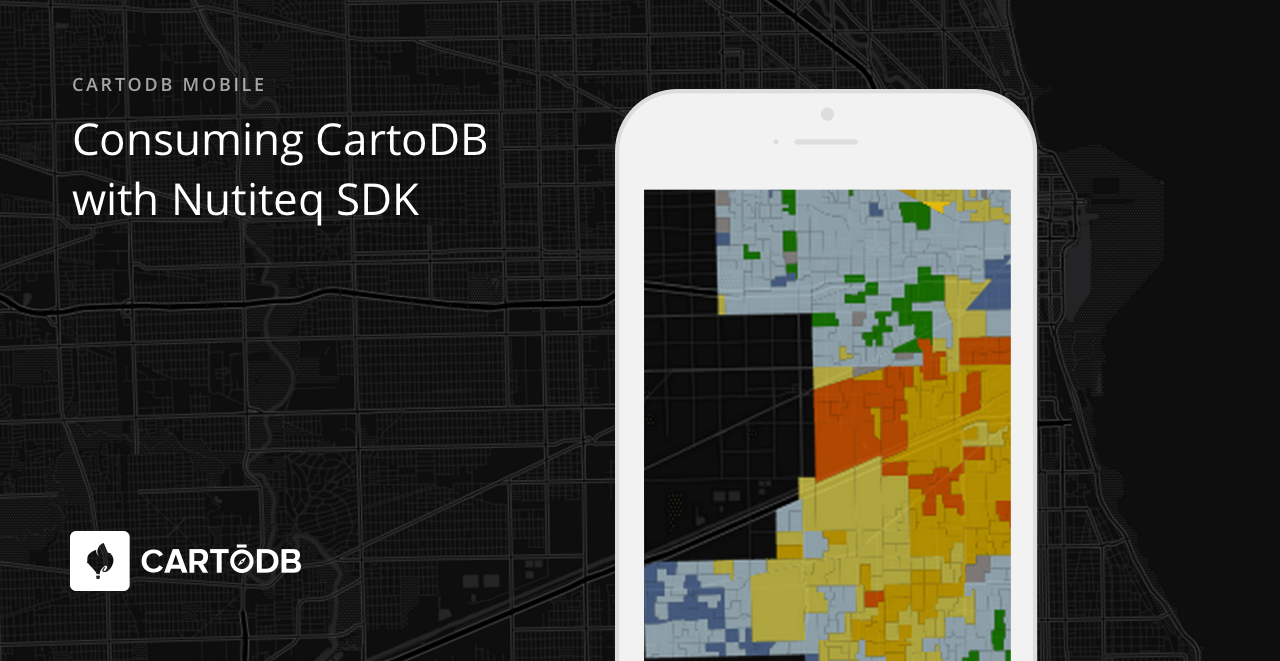
This is our third post of CartoDB’s mobile blog series. If you’ve missed any of our previous posts you can view them here and here. In this edition, we’ll continue to build on the information from the earlier posts and present new and compelling details on how you can consume the same CartoDB platform and engine that you love with the Nutiteq SDK.
-
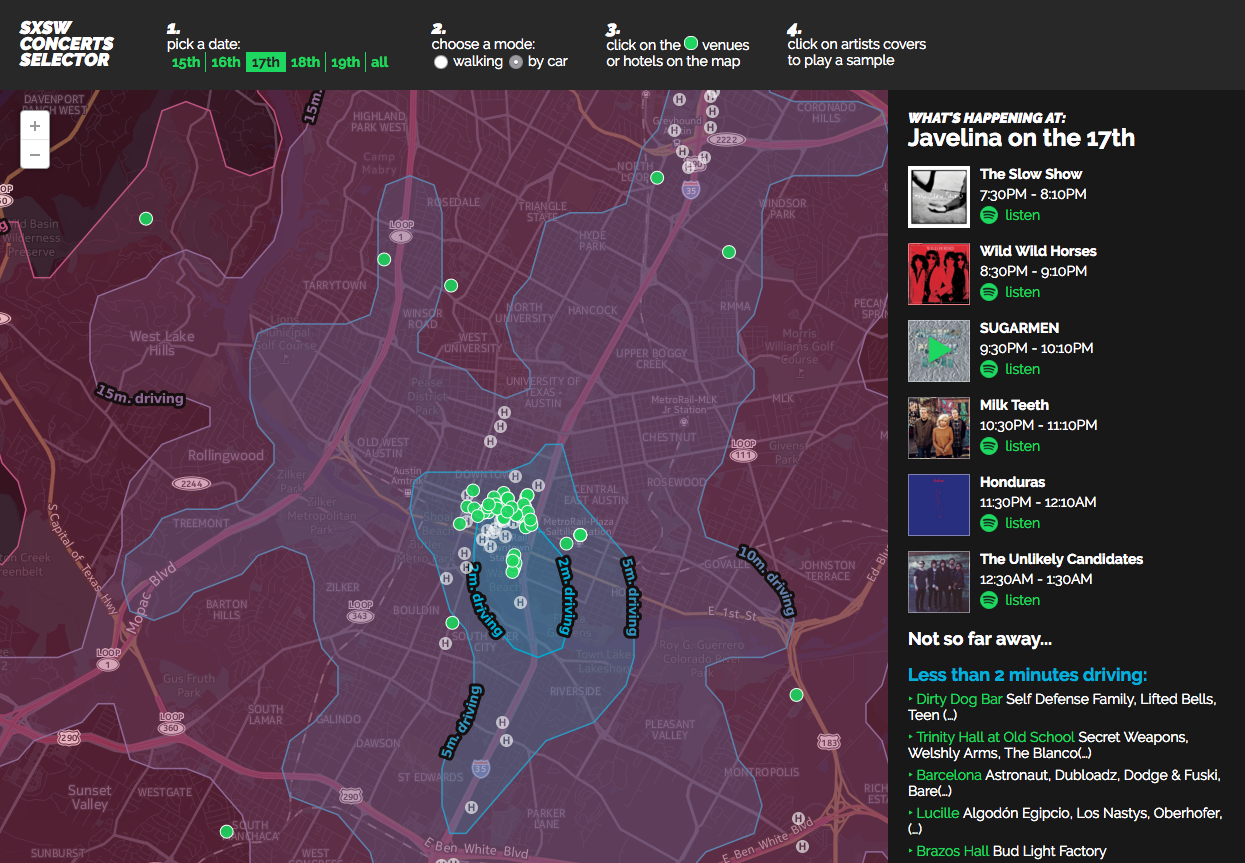
Planning where to strategically go next can be a daunting task. There are numerous factors to consider, like time. At major festivals, like SXSW, planning how long it takes to move from place to place doesn’t have to be so intimidating anymore. Time and Distance Isolines (also called isochrones), a new feature coming to the CartoDB platform, allows you to measure time directly through SQL statements. Time isolines provides insight and analysis on how long it takes pedestrians to move from one hotspot to the next, making tactical business planning a cinch.
-
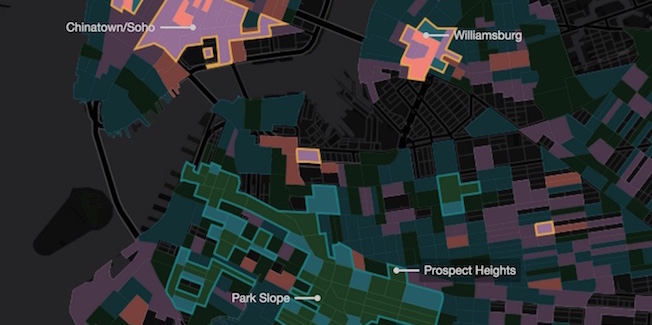
Airbnb has become a lightning rod for controversy about the so-called sharing economy. In tight housing markets – in particular, New York City and San Francisco, many have claimed that Airbnb contributes to the displacement of longtime, poorer residents.
While these reports are alarming, none have tried to map the major concern – concentrated neighborhood impact from Airbnb’s heavy concentration in small parts of cities. By leveraging US census data in CartoDB’s Data Observatory, it’s possible to isolate the impact of Airbnb to a the level of just a few city blocks.
-
You might have seen the blog post we produced a little while ago looking at the
L train closure and the possible impact that might have on L commuters to manhattan. One of the most visually striking elements of that post were the maps where we showed walking routes for people in Brooklyn to their nearest L. We did it a few times, once like above showing all people in Brooklyn, and a second time showing cumulative walking corridors for people that live on the L. You might have wondered how we made those lines, so in this post we will show you how. -
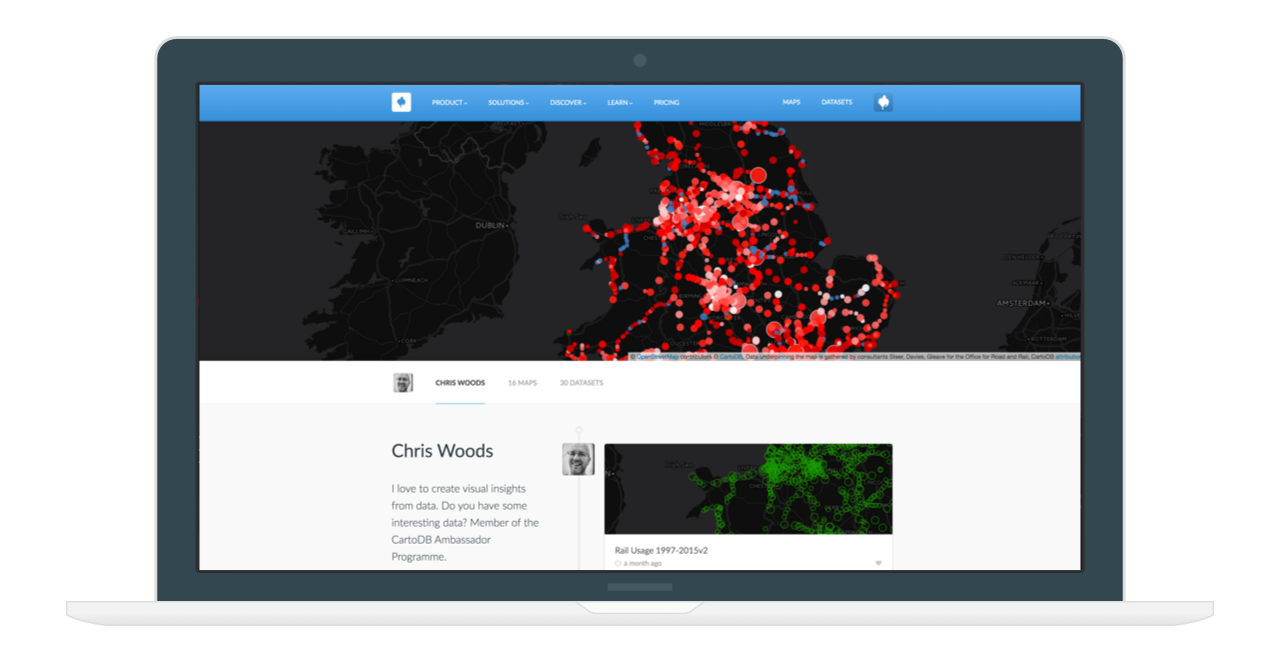
At CartoDB we do our very best to spread the word on how anyone around the globe can leverage data and visualizations to make better, faster decisions. When great mappers make and discover insights through location intelligence we like to reward them.
We are proud of our carefully selected and very talented CartoDB Ambassadors. CartoDB Ambassadors are deeply involved in the mapping community and are inspirational educators that use CartoDB technology to empower future mappers. Ambassadors play an essential role to our mission of democratizing location intelligence by producing amazing maps using open data and educating others about the power of CartoDB.
-
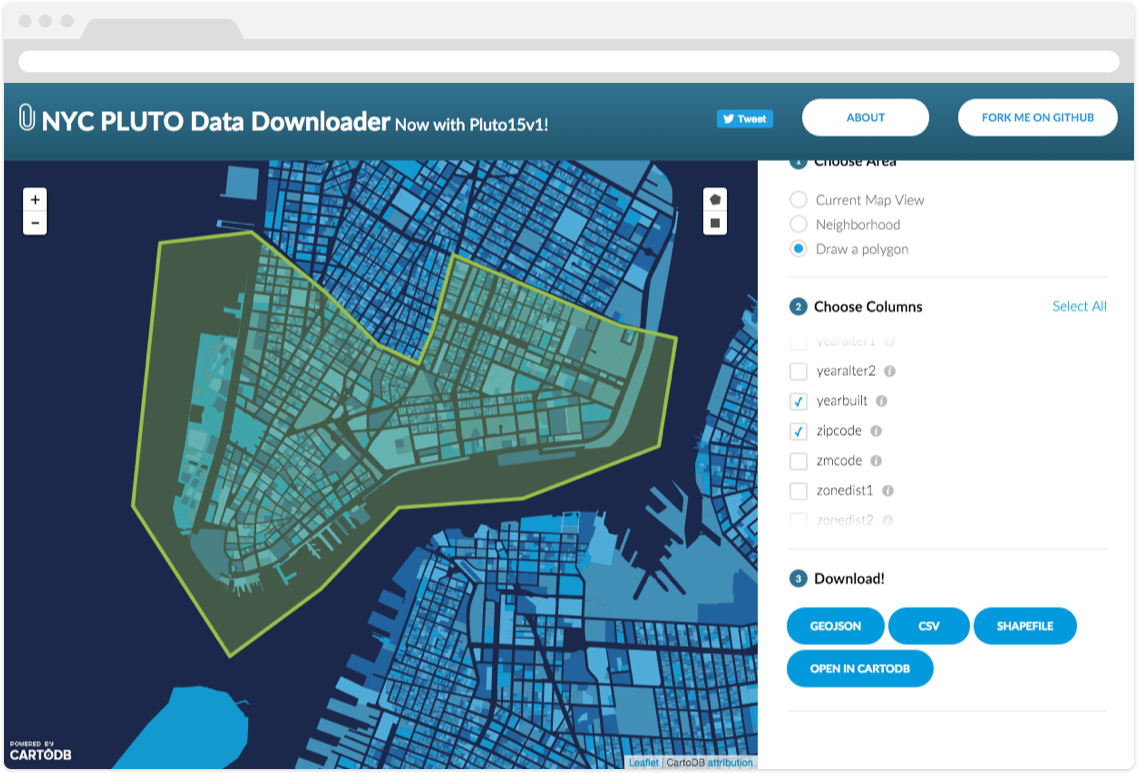
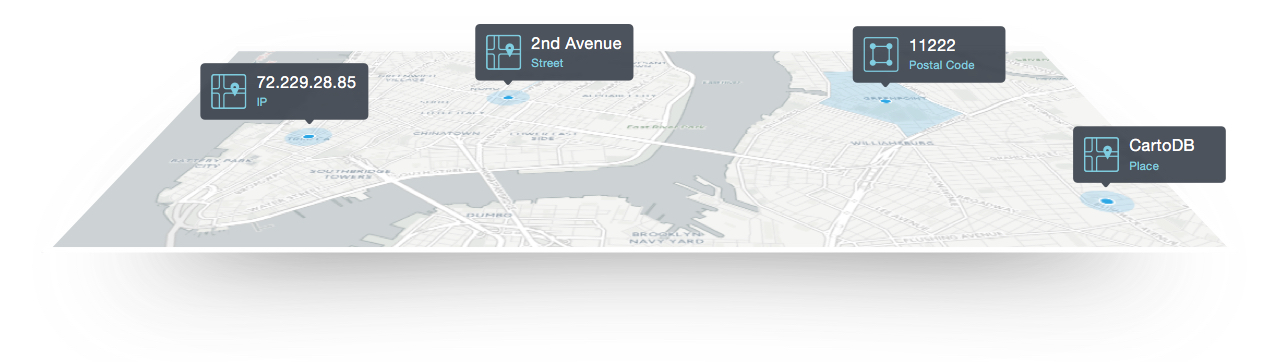
As more governments and businesses are adopting proactive open data policies and programs, the infrastructure of data publishing is becoming increasingly important. The time-honored tradition of publishing file-based machine-readable data on the web is still alive and well, but live, api-accessible databases can help when publishing data that is updated frequently, or is so large that publishing it as files becomes inefficient. Luckily for you, if you have a CartoDB account, you already have a live, api-accessible database at your disposal! Read on to learn how CartoDB can help make your open data shine.
-
 Location intelligence is an often heard term, but what it means and how it can benefit businesses, institutions and individuals may not be immediately obvious. Location intelligence is more than analysis of geospatial information or geographic information systems alone, it is the capability to visualize spatial data to identify and analyze relationships. Evolving from GIS, location intelligence provides analytic and operational solutions across organizations.
How does all this data help people, and what about the customer or client? Organizations have discovered that data can be one of the best ways to get insights about customers and how to serve them better, increasing brand loyalty and improving customer relationship management. Linking customer addresses to a geographic area and then running these against internal company data and external demographics such as census data and income data, or other open data can provide unprecedented levels of detail. Who people are, what they do, and how and when they consume is tied to the where in essential ways. What is their neighborhood, commute, and workplace?
-
Welcome, CartoDB community, to Deep Insights—CartoDB’s solution to make the invisible visible, and allow you to discover unseen correlations and patterns at an unprecedented scale.
-
We absolutely love client success stories that make use of big data and provide great insights for customers all over the world. In this case, the insights are for one of the fastest growing global fields, real estate.
-
Last night the Carolina Panthers were smothered by the Denver Broncos in what ended in a two-touchdown lead game. How did the U.S. react? What did they think about that last call on possession? Will we ever come to a consensus on whether Beyonce stumbled during her performance?
-
Did this past weekend’s East Coast blizzard leave you with the feeling of wishing you could pinpoint where you built that wicked igloo during Snowstorm Jonas?
-
 For two days, CartoDB will be at the Big Data Innovation - Las Vegas Summit! From January 28-29, we will participate in world-class presentations, panels, discussions, and networking.
 -
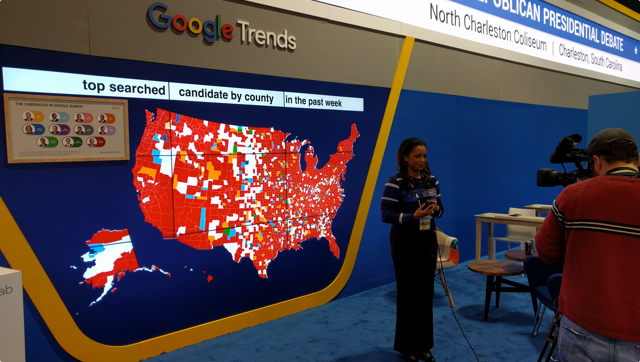
With less than a month away before the first U.S. presidential primaries, all eyes are on the headlines for the latest jabs by Trump, Hillary, and the gang. Just how do journalists get the spin on the topics and trends this election season?
-
We’ve got a theory that mapping the global impact of data and information helps create better, more socially aware, and global citizens.

-
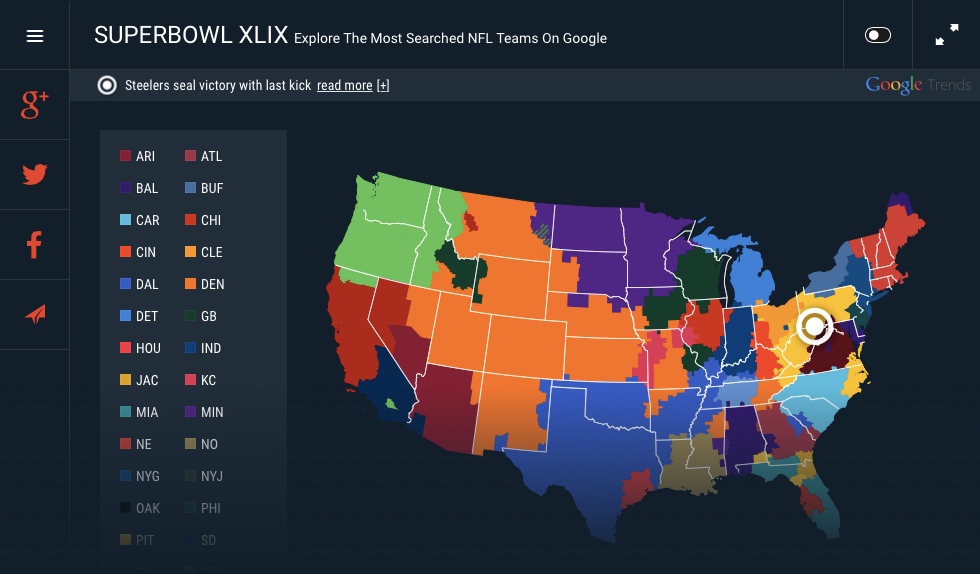
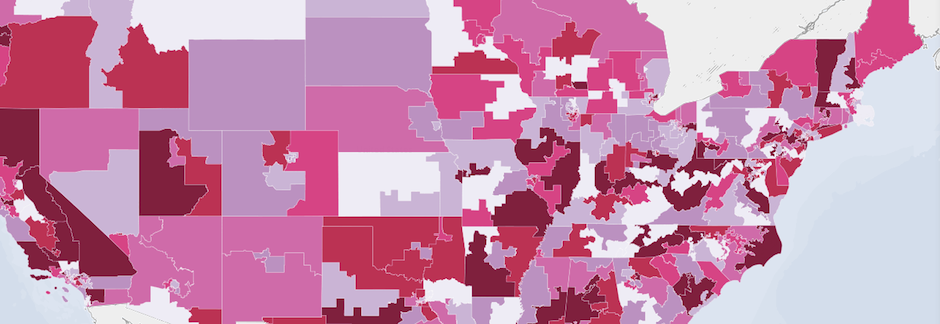
In case you were trapped on a moutain, in a blizzard so thick you couldn’t see your hands in front of your face, and just got back to civilization this morning, let us say the Superbowl happened last night. The team from the East Coast beat the team from the West Coast in a game where many fans held their breath until only 10 seconds were left.
If you love football, or if you don’t love football but you love maps, we want to show you a couple of maps that use CartoDB to show us some neat things about the Superbowl last night.
-
We all need an assist when we’re thinking big. At CartoDB, we’ve seen some of the most original user visualizations inspired by common data. So, we’re focused on growing public data offerings to help you make maps that tell more creative and comprehensive stories.


