-
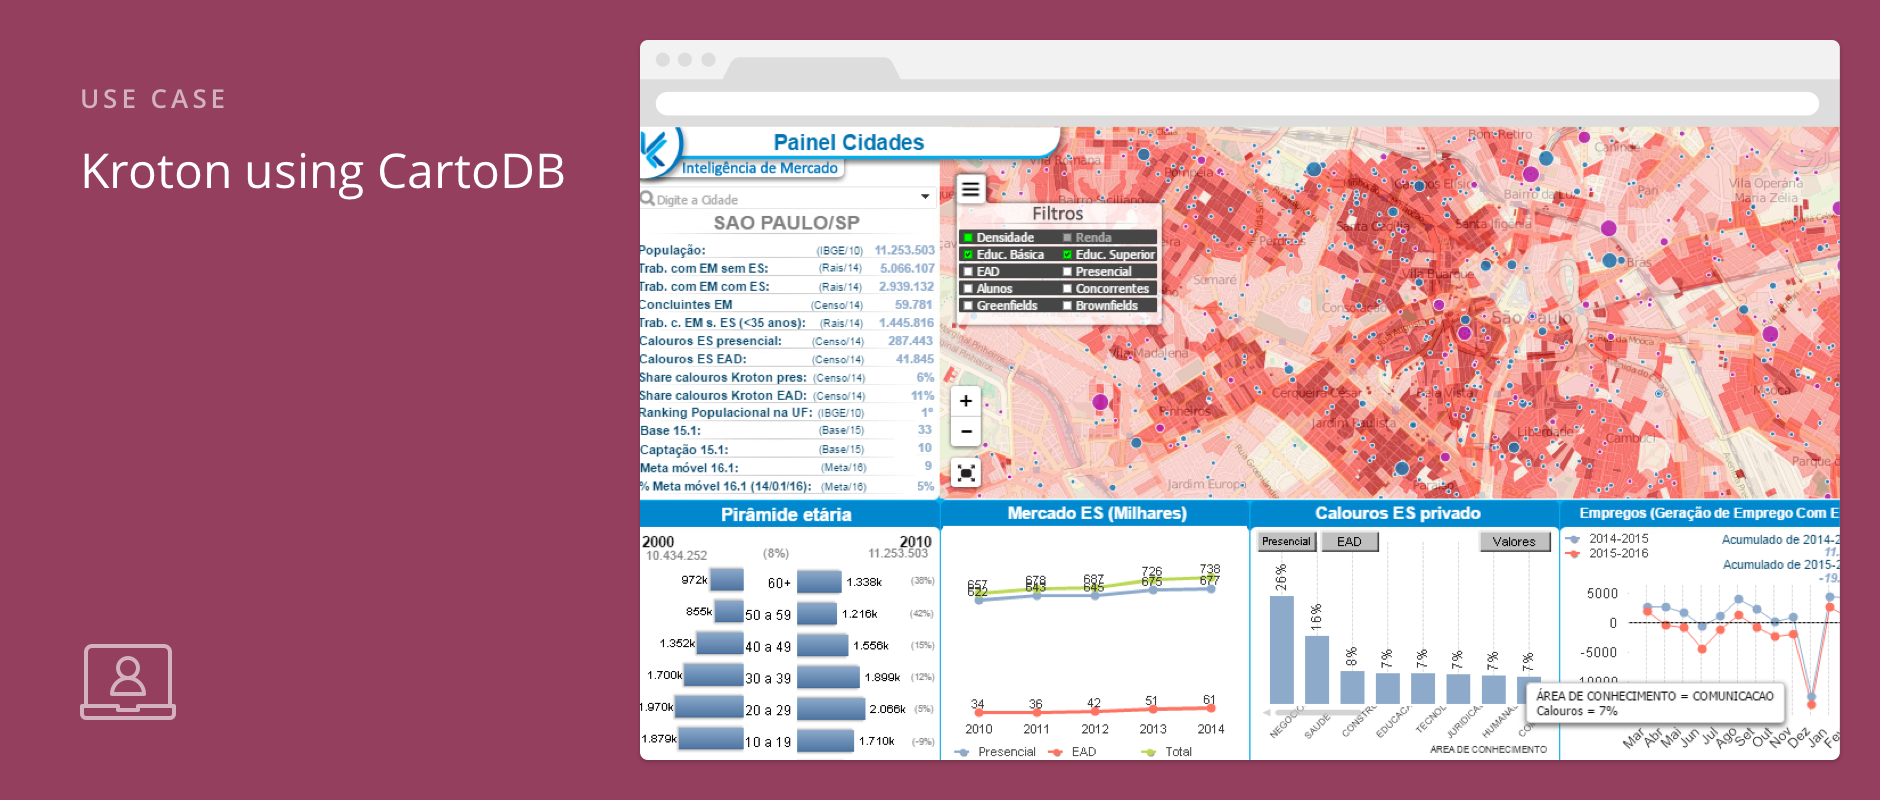
When your organization has locations all over the country, or world, sometimes it’s hard to keep up with the progress of different targeted marketing campaigns. How you analyze all that data to determine the impact your organization is having (or not), makes all the difference in coordinating your next move.
-
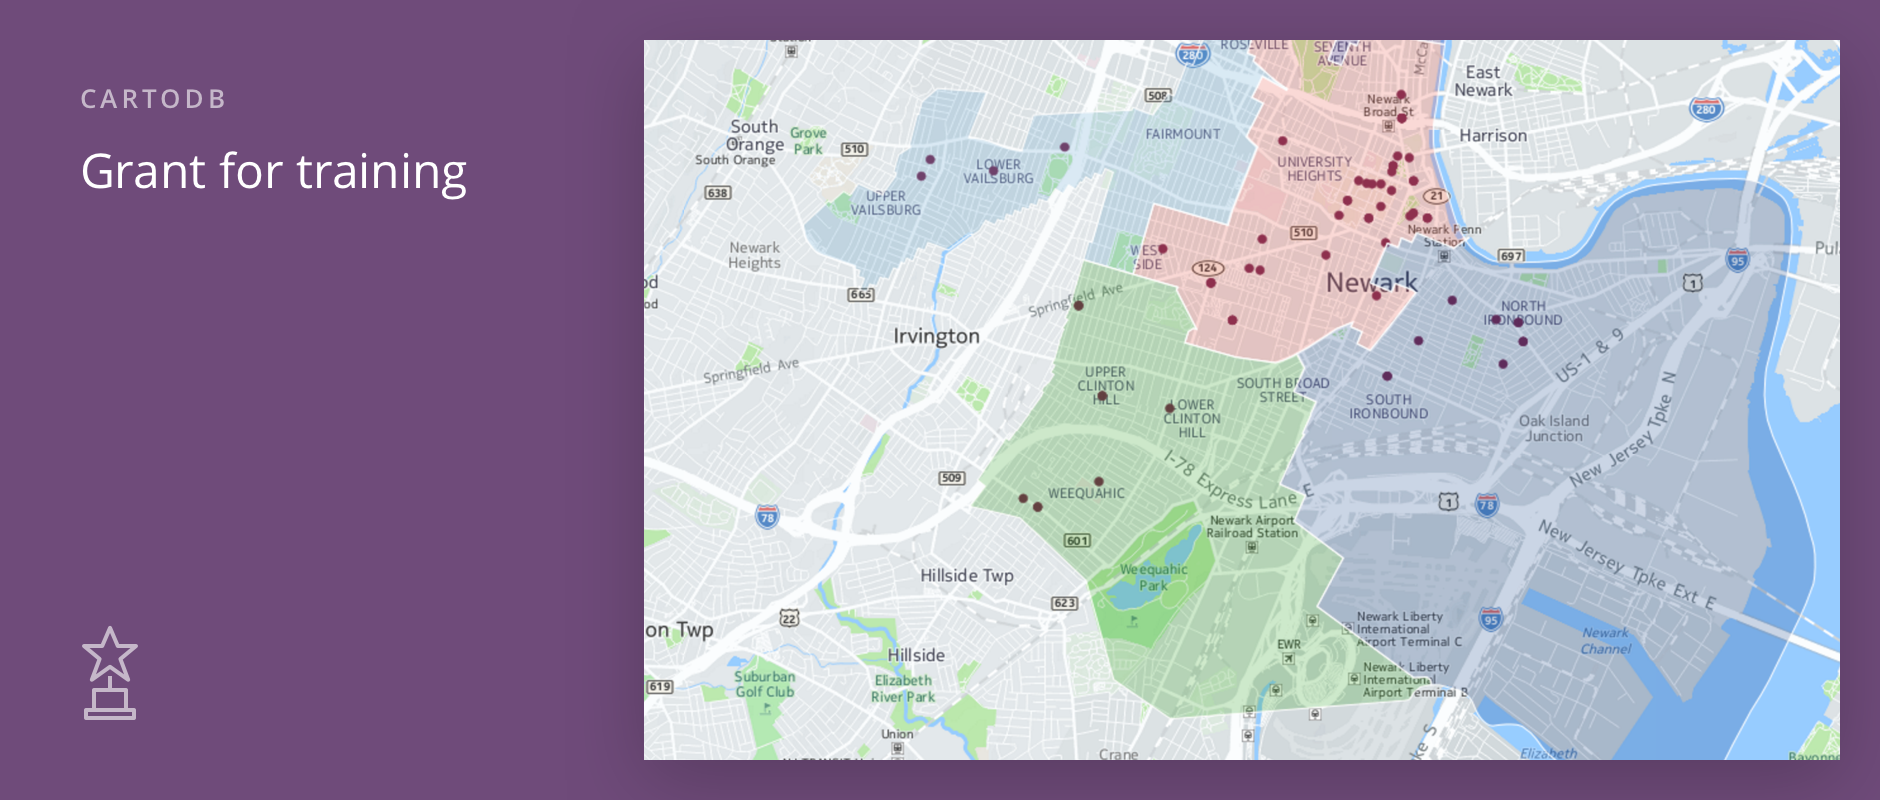
CartoDB is constantly engaging with and supporting our community of mappers, developers, open data champions, development practitioners, students, educators, journalists, and innovative companies. We offer workshops and webinars to organizations, companies, and groups who want to learn how to harness the power of data by mastering our mapping platform.
-
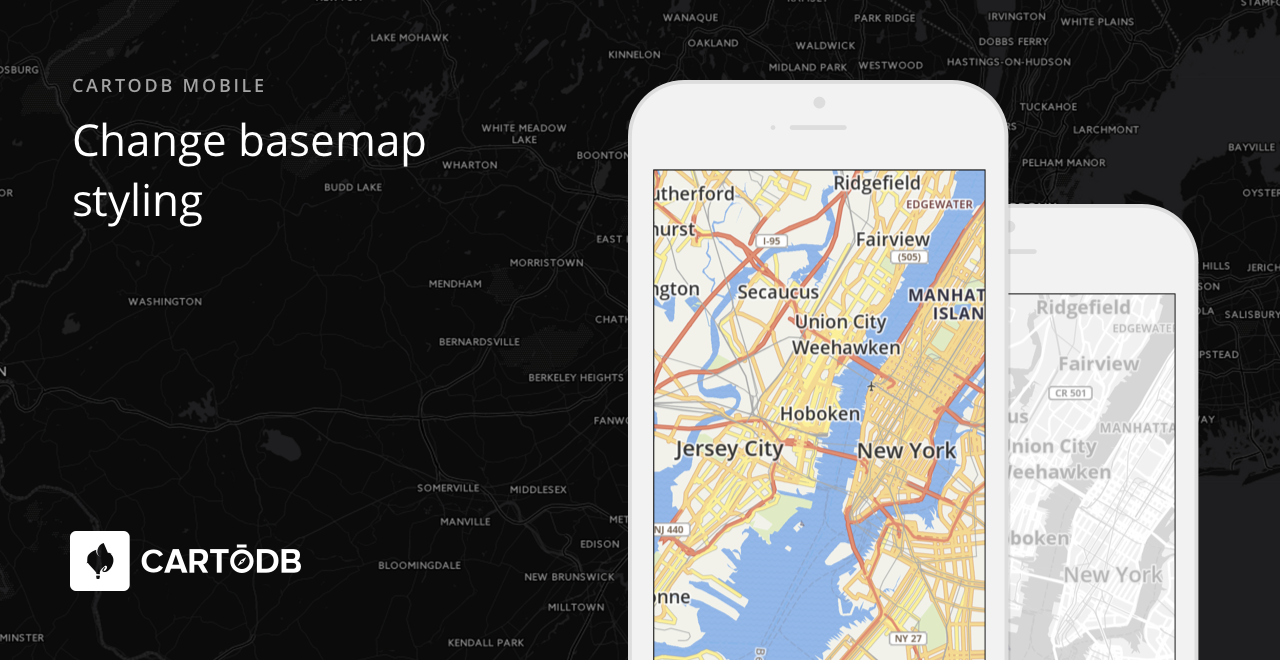
Now that you’ve mastered indoor mapping, let me introduce you to another great benefit of the mobile SDK. One of the key advantages of vector-basedmaps is that you can re-style them on the client side using just one single map source. This is especially useful for offline map package cases.
-
How we view, collect, and process data has gone through a revolutionary transformation. Roughly 45 years ago, the most widely disseminated image of the Earth was captured by NASA, The Blue Marble. Eight years ago, smartphones were invented – forever changing the way we take images and store and collect data. Now, companies like CartoDB are ushering in the age of data analysis.
-
From the very beginning, CartoDB has focused and researched how to make visual exploration of location data easier and more compelling. For most of that research, we rely on standard languages that are easy to use and learn, such as SQL and CartoCSS.
Now, we are taking CartoCSS a step further and adding new capabilities centered on data-driven styling. We’ve done this before with torque.js.
-

Next month CartoDB will be at Alteryx Inspire 2016 Conference, in San Diego, CA from June 6-9, as a platinum sponsor! Come visit booth #P2 to view our demos and learn how CartoDB can enhance your data workflows and analysis by providing even more value through location intelligence.
-
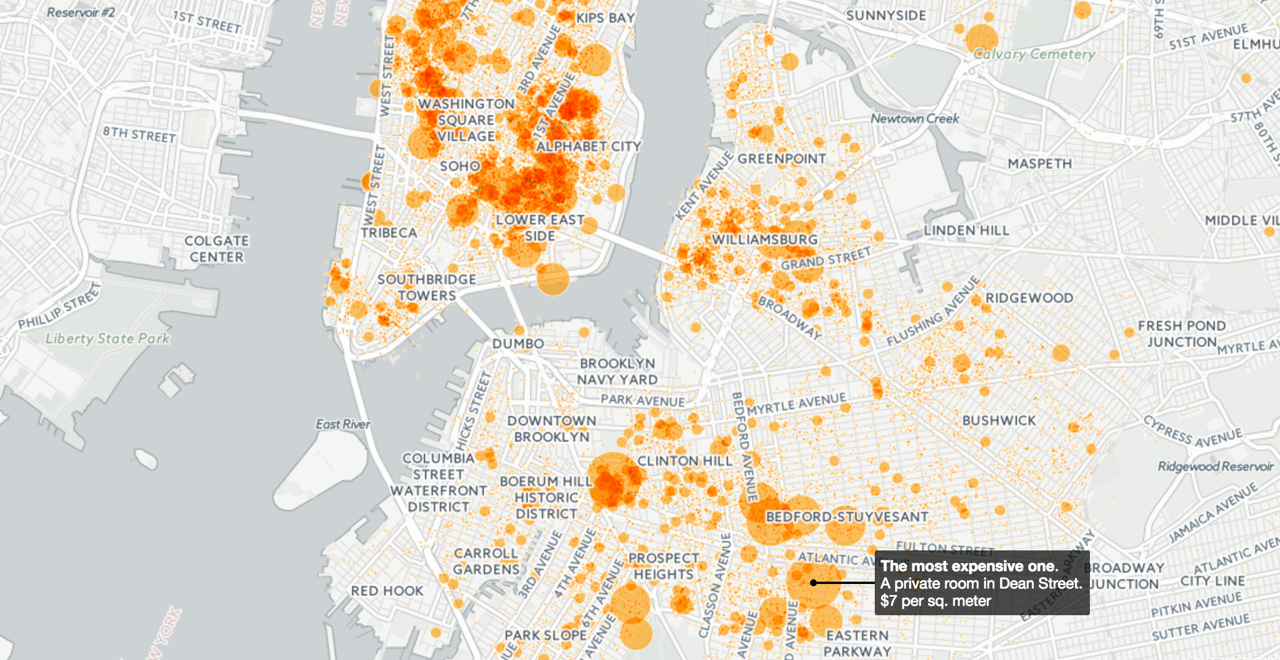
When visualizing, on a map, tens of thousands or millions of points in a dataset, data points may be spread all around the world, or be confined to a single country, region, city, or even some smaller area. In any case, there will be a zoom level in which the whole dataset is represented in a single 256x256 pixel tile. The “great mother of all tiles”, tile 0/0/0, will inevitably have to show the whole collection of points.
-
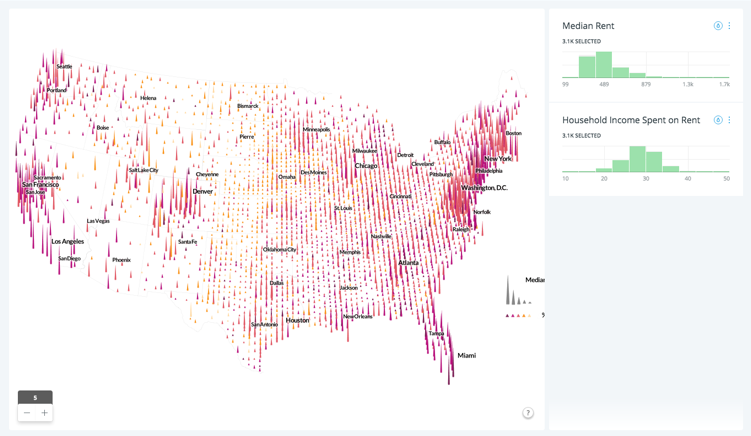
Lately, there has been a lot happening at CartoDB related to the visual exploration of location data. We’ve been researching, for quite a while, new ideas for visualizing thematic information on the web. Apart from color, we might have something to share with you soon, we are investing time experimenting with different methods for symbolizing data, and a set of tools to drill-down into other (non-visual) attributes of the data.
-
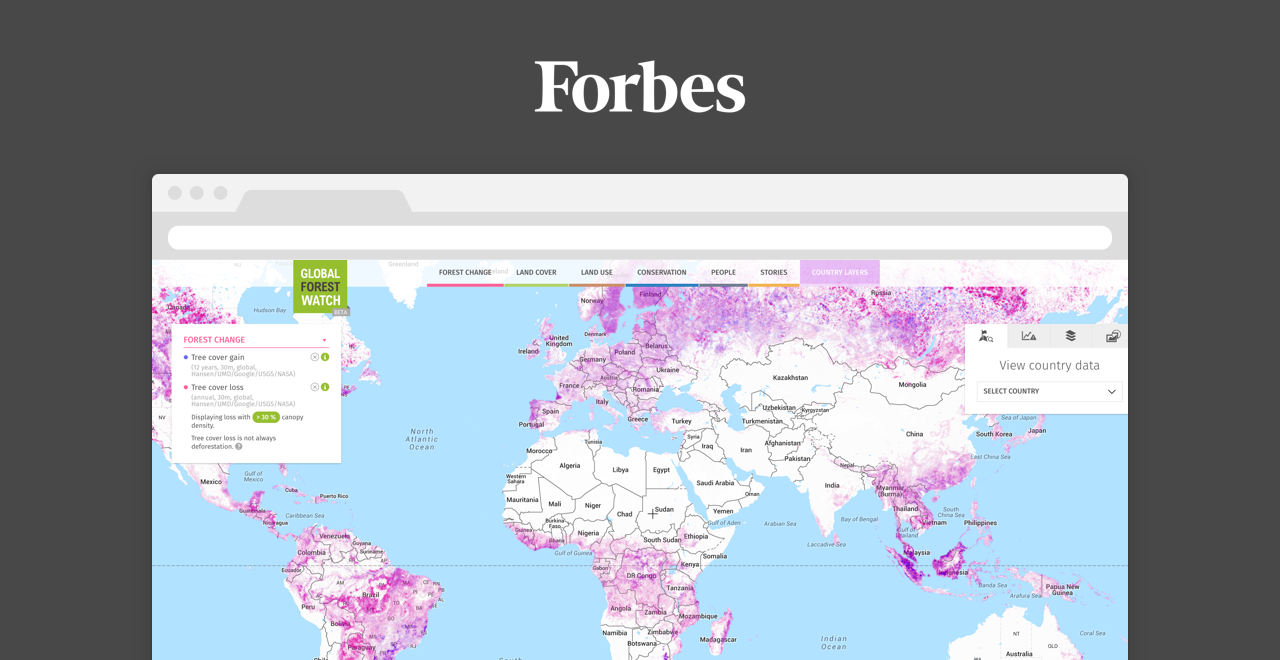
In practice, journalist require the most trusty and reliable information to disseminate messages to the public. There is no better way to do that than by aggregating facts, or data, and analyzing and providing that analysis in the most accessible way possible. To do so, journalists across sectors and media need a technology that is compatible with the realities of the modern newsroom and provides data analysis on the go. CartoDB is that technology for the new media sector.
-
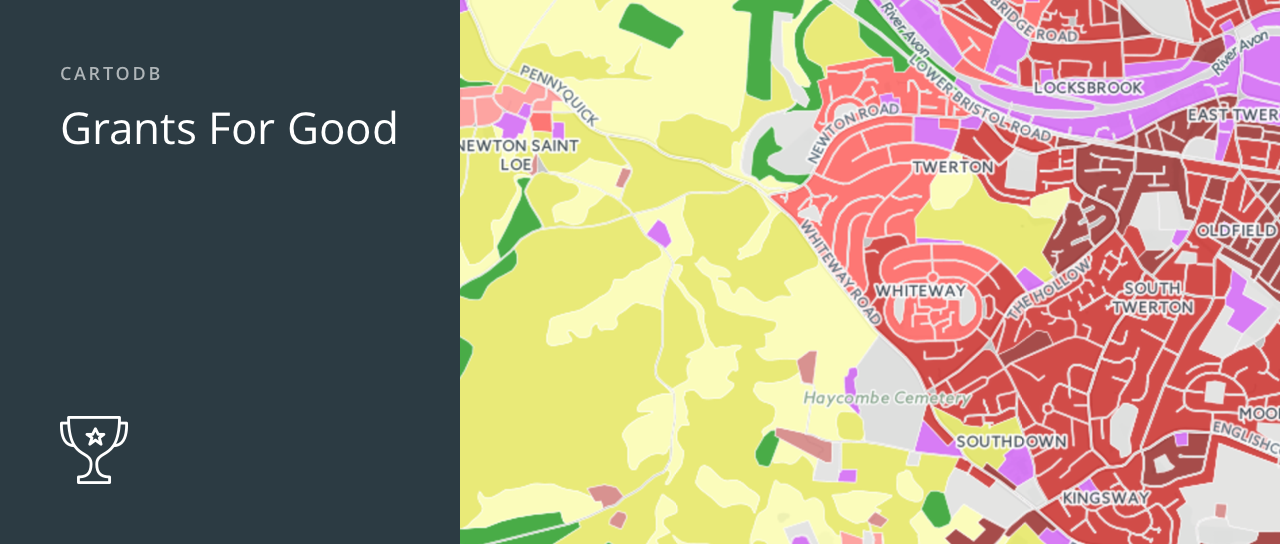
At CartoDB we are fierce champions for open data! That is why our Grants for Good Program is supporting organizations and volunteers who advocate for more access to open data using innovative technology and crowdsourcing techniques. CartoDB work with stakeholders who are using open data and maps for research, business intelligence, deep analysis and better communication. We are happy to introduce you to our newest grantees who are blazing the trail in these spaces.


