-

Today, we consume information primarily through mobile devices. From the start, CartoDB has supported visualizations on-the-go. We believe that form and function make a good pair, which is why our maps are designed to live with the technology that supports their creators. Our conviction was a hard-won technical challenge.
-

CartoDB is more than just a useful tool for visualizing spreadsheets. When you use CartoDB you have the ability to tap into powerful data manipulation and GIS tools as well. To showcase these capabilities, we are creating a short series, Mapping the invisible. As the title may suggest, we’ll be exploring different datasets, doing analysis and visualizations to tell stories that are hidden in that data, so you can learn and get inspired to work with CartoDB.
-
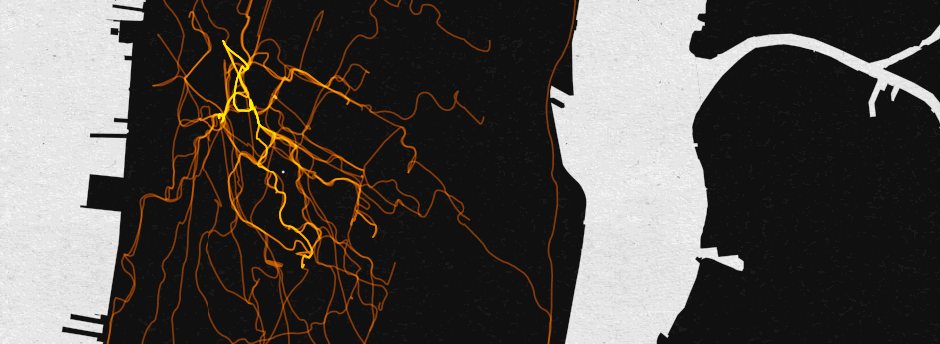
Welcome Miles Grimshaw to our Map of the Week series. Miles has used Kimono Labs and CartoDB to visualize one year of his Citibike trips (the bike service in New York City). Here is the result.
-
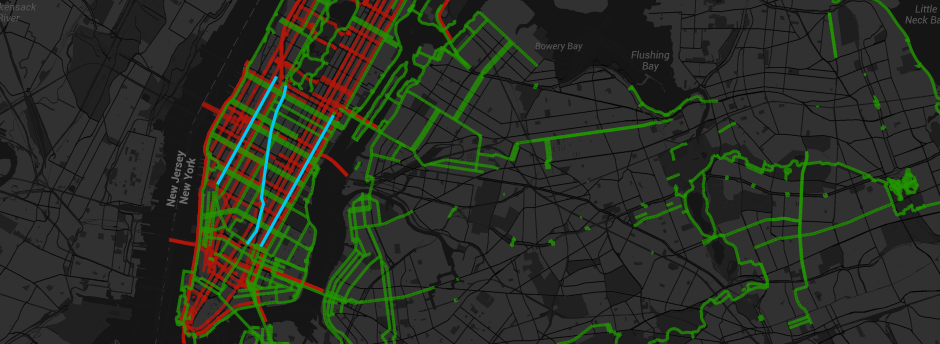
We welcome Jeff Jenkins to our Map of the Week series. Jenkins is a cyclist, board gamer, and software engineer living in New York City.
He decided to take NYC’s data on truck routes and overlayed it onto a map with bike lanes to prove that there is a need for better southbound bike lanes in central or eastern Manhattan.
-
Creating maps is quite addictive, so you may end up with tons of tables and visualizations in your account that are part of publications, and which you don’t wish to change.
Today we are launching a new way to prevent undesired changes to your published items. From now on, you will be able to lock your tables and visualizations which will make them disappear from the default view of your dashboards and CartoDB will warn you each time you want to edit them.
-

On the 24th of July, our senior scientist Andrew Hill hosted a webinar to teach how you can use CartoDB to develop geospatial applications.
-
CartoDB is the easiest way to create amazing maps with your data. The interface is creating a new standard for user experience in the mapping and data analytics community. This allows us to work with users from diverse backgrounds to create maps. From hobbyists to educators, researchers, and general business, we are enabling a new generation of mappers to work with their data.
-

We welcome Timo Grossenbacher to our Map of The Week. He’s currently working as Interactive News Developer at the Swiss daily newspaper Tages-Anzeiger, based in Zurich.
-

More Odyssey.js stories keep popping up from different parts of the world. Here are some recent examples:
-

Welcome Sarah Ryley to our Map of the Week series. Sarah is the data projects editor at the New York Daily News, which has the second-largest newspaper website in the United States. Crime reporting is the bread and butter of the Daily News, so Sarah has been focused on making crime data interactive and accessible to the publication’s millions of readers.