Big Data from Space: Using CartoDB to track environmental change

Here at CartoDB we have a lot of experience working on environmental data. In fact, the mission of Vizzuality, the company behind CartoDB, is to “bridge the gap between environmental science and society by using data visualization.” Most people don’t know that CartoDB was actually first created to visualize all species on Earth on a map. We couldn’t do it with existing tools because of the amount of data and complexity, so we created our own software.

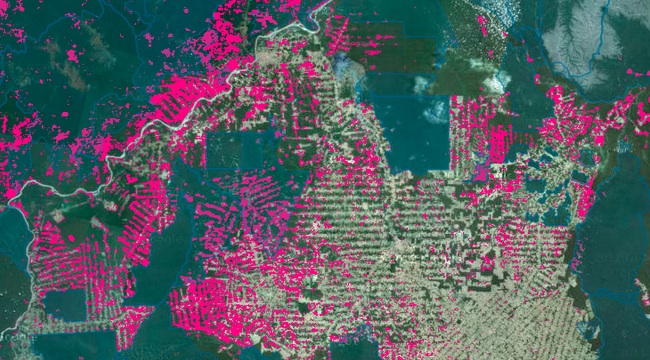
This past week we presented some projects using CartoDB at the Big Data from Space conference at the European Space Agency. In particular we’ve been collaborating with the World Resources Institute on a forthcoming initiative called Global Forest Watch 2.0. This platform, which is currently under development, employs the FORMA algorithm for early deforestation warning, developed by our friends at the WRI Data Lab.
In this project we showcase the power of data visualization to find stories of deforestation around the world. For example, on the following video you can see how in an area of Malaysia, a big area suddenly becomes deforested very quickly, over a period of a year, and inside a Protected Area. What is going on?

It turns out you are looking at the construction of a dam. The Bakun dam flooding commenced on 13 October 2010 and has since put 700 km² of land under water - equivalent to the size of Singapore. This is the deforestation we are seeing on the visualization.

You can learn about the environmental and social damage of the dam in this Wikipedia article.

Mapping Big Data Is Hard. Using Vector Tiles Data Cubes To Uncover Hidden Stories
Although there is a bit of over-usage of the Big Data term, it is actually true that handling large amount of data on maps can be very challenging. We created the VisualRaster technology to encode large amounts of data on vector tiles that we visualize using the Torque library.

The concept behind it is the use of data cubes. We represent space in two dimensions and add additional dimensions for time and intensity of deforestation. This is what allow us to later create very compelling dynamic visualizations that let you to discover stories like that of the Bakun Dam.
It is common to hear that Big Data needs different tools for performing analysis. We think the same is true for visualization. Big data visualization will require a new types of technology that allows you not only to handle large amounts of data, but to discover the trends hidden in them.