-
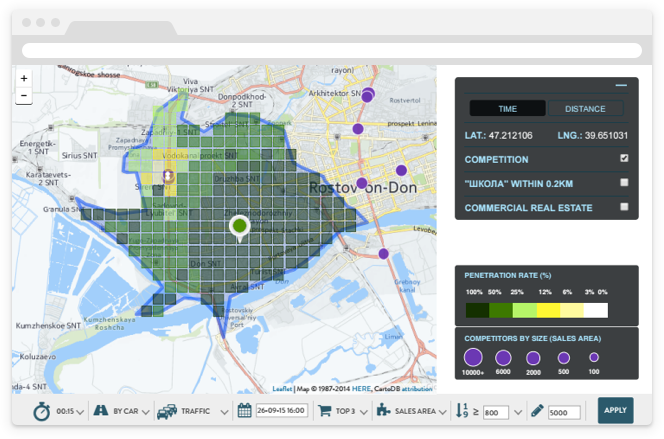
Businesses and real estate agencies can save time and money by adding spatial analytics to their intelligence systems. Location analysis can provide insights that support and improve decision making from marketing to supply chain logistics and operations. Rilos, an international business-to-business company, fused business intelligence and geographic analysis to discover powerful new insights. Now that’s location intelligence.
-
At CartoDB we listen to what our users need and want. We are constantly brainstorming and coming up with new ideas, but it is always the very best in user experience that we hope to deliver. This month we’ve launched two brand new sections on our website: Explore and /me!
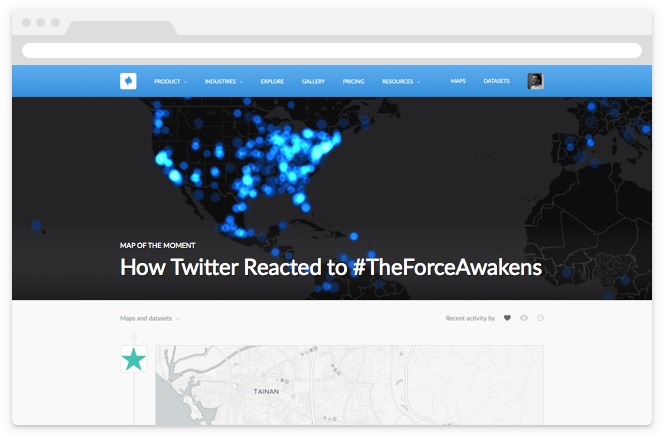
Visit Explore to see the top trendy maps of the day. The new explore section allows users to browse the most popular public CartoDB data-driven visualizations. Now you can see the top 10 maps from all CartoDB users based on three criteria: likes, views, and date. You can also filter your list by “maps”, “datasets”, or “maps and datasets”! Additionally, you can order visualizations by most ‘likes’ and views.
-
From real estate and government organizations, to the financial sector—location intelligence is used by many industries to uncover a myriad of insights in big data. Media and Creative agencies can also harness the power of insight and uncover many secrets through a great data-driven visualization for increased brand engagement and international exposure.
-

Howdy Mappers! CartoDB is happy to be a platinum sponsor of the Texas GIS Forum, the state’s premier conference for the geospatial professional community.
-

To an outside observer, serving a population of 150,000 map creators and millions of map viewers might seem like a simple matter, but to us it’s a big complex deal, and we’re always looking for ways to make the CartoDB
platform faster! -
If you’ve ever seen an animated map on the web, or read our technical blogs for the past year, you might be familiar with Torque, CartoDB’s library for animating time-series data on maps. You can already build a range of Torque maps with point data in our Editor GUI: plotting dynamic events, social reactions, traffic patterns, categorical comparisons, and hotspots of activity.
This week, we went further, open sourcing Torque.js, and building documentation for developers to get started customizing Torque code for their projects and contributing to the library at large.
-
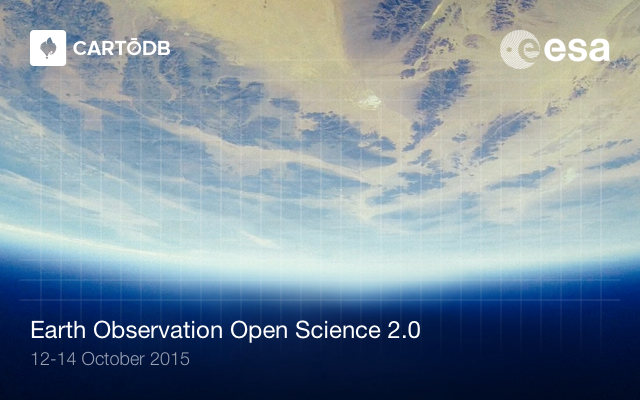
With the recent discovery of water on Mars, what better time than now to think of fresh new ways of space exploration and data visualization, as well as how we view the third rock from the sun?
-
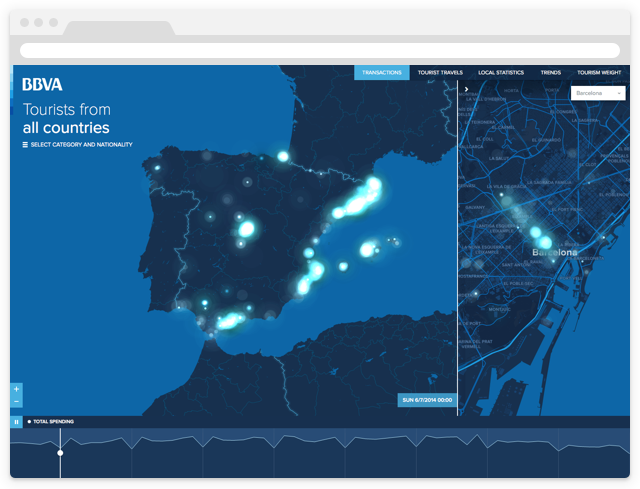
Spain is the number one tourism country in the world. With sights like the Museo del Prado and Royal Palace of Madrid, it is hard not to see how such spectacular beauty could ever be overlooked.
To assist in visualizing the majesty of this European gem, Vizzuality and CartoDB are proud to announce our latest release: an interactive tool to analyze tourist spending in Spain during the summer of 2014. Using BBVA Data and Analytics, you can see how tourists of different nationalities spent their time in Spain. Take a look at this UN-BBVA-LIEVABLE visualization and welcome guest blogger, Jamie Gibson from Vizzuality!
-
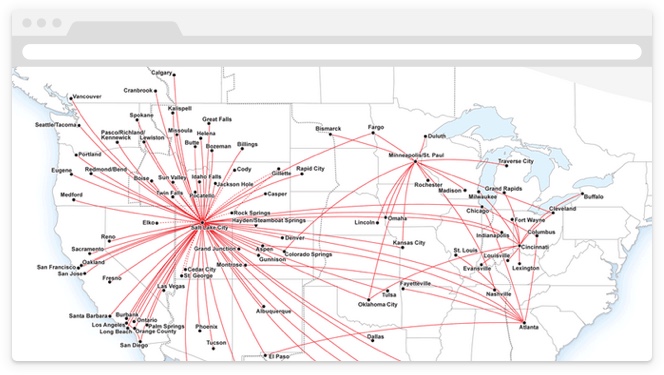
As a child, nothing was more exciting to me than a chance to ride on an airplane. And after enjoying playing with the seatbelt buckle and feeling the crazy push of take-off acceleration, I would usually settle in and page to the back of the in-flight magazine where the airline route maps were: where were we going today, and where could we go tomorrow?
-

Here at CartoDB we are always looking for new ways to enable our educational communities. From our commitment to Education and Research in the Classroom to our popular Educator’s Nights and workshops at universities, we’re working hard to spark new ideas in geospatial visualization and analysis across all professional fields.


