-
Every year, all around the world, people celebrate all things geospatial in mid-November. It is a great opportunity to pick up new skills, learn new platforms, and -most importantly- make and share new maps.
-
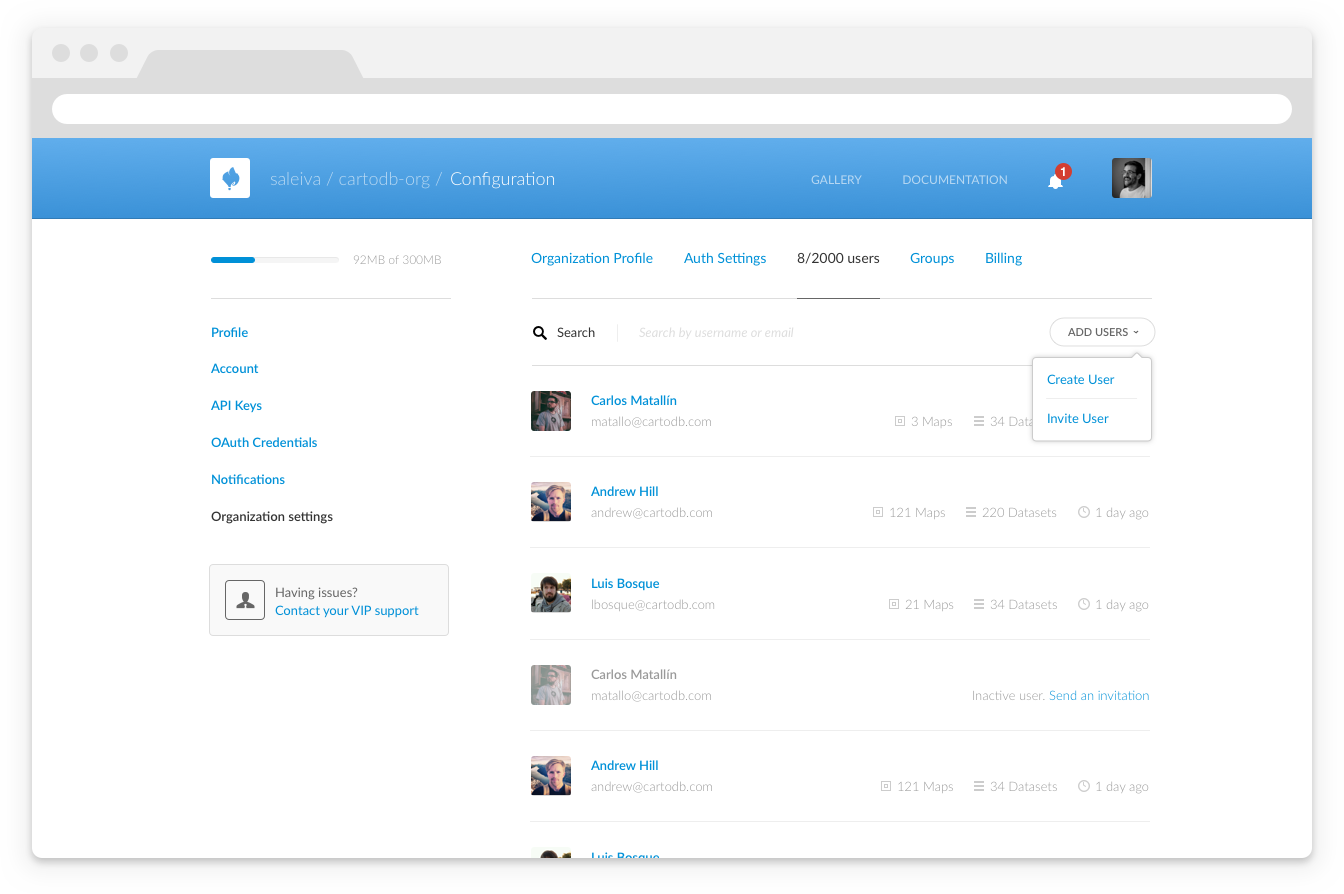
Sharing insights with your peers and colleagues just got easier. CartoDB now permits organization administrators to set up user groups to share data-driven visualizations and datasets with our permissions management system.
-
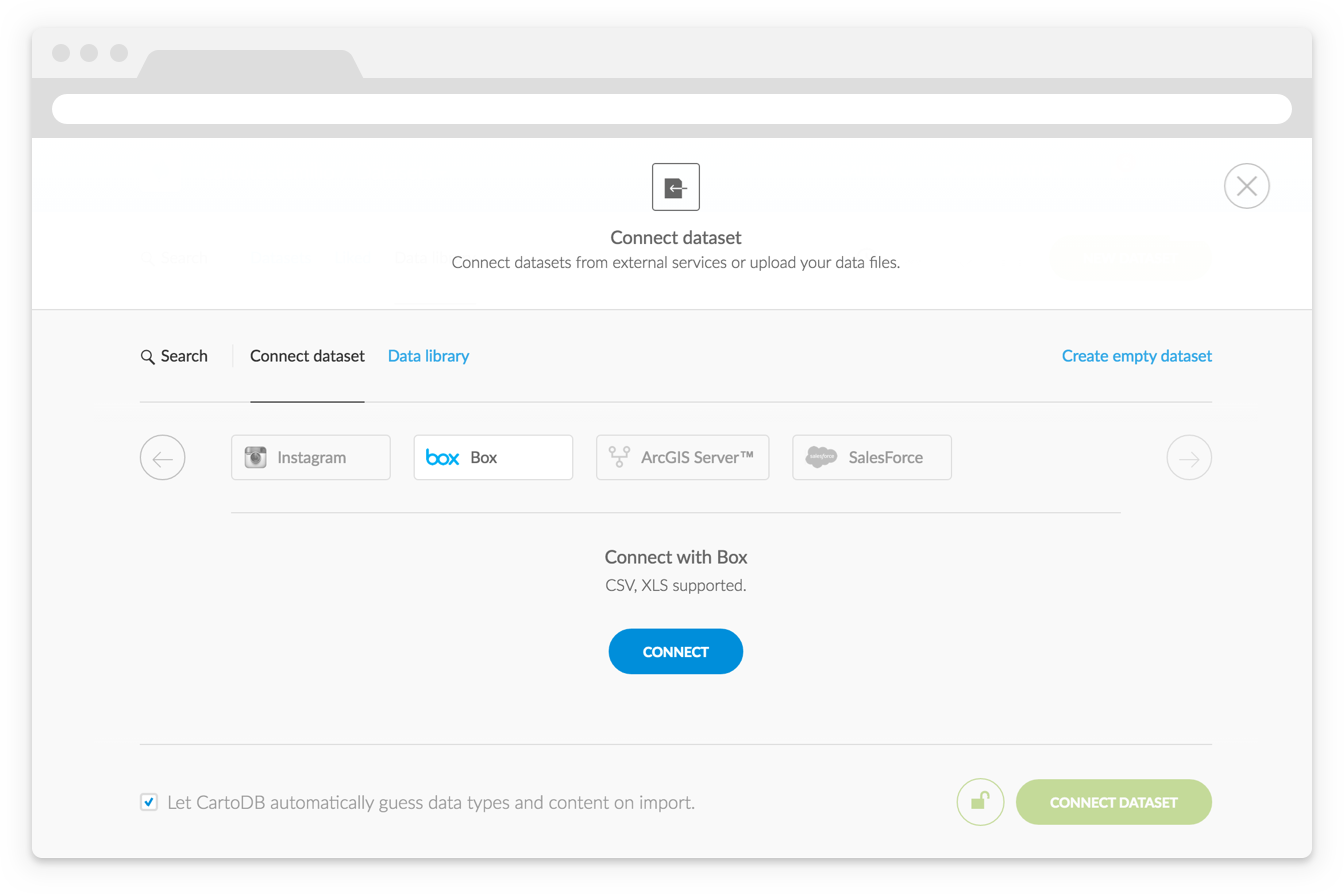
CartoDB’s strength is its agility working alongside other excellent tools in a mapping workflow. QGIS (Quantum GIS) is one of those tools, and its position as a no-cost open-source GIS software leader makes it an accessible, and affordable choice in exploring data. Now, the two can work together much
more seamlessly. -
This past Tuesday marked the 111th anniversary of the New York City Subway, an iconic transport system which to-date has the most active stations of any underground system in the world. Subways operate in over 55 countries globally, throughout a growing collection of 150-some cities; and the art of mapping subterranean transit continues to fascinate information designers and commuters alike.
This past week, Cooper Union hosted a sold-out event called “The Subway Map: The Last 50 Years, The Next 50 Years” for a packed crowd of New Yorkers, and in honor of this, we’ve assembled a quick collection of some of the most interesting subway maps in CartoDB, along with a little tutorial on using subway data in your own maps.
-

In the ever changing and rapidly growing ecosystems that define cities, the CartoDB platform has become imperative in enabling citizens, city agencies, and private industries to implement easily adaptable, real time enabled, and analytically robust data driven solutions.
-
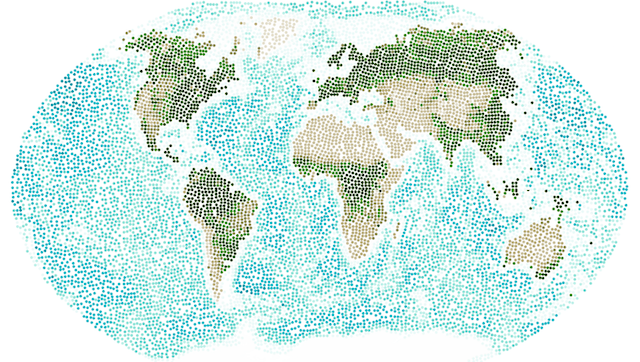
Most maps that we see on the web use the Web Mercator projection. Web Mercator gained its popularity because it provides an efficient way for a two-dimensional flat map to be chopped up into seamless 256x256 pixel map tiles that load quickly into the rectangular shape of your browser.
If you asked a cartographer which map projection you should choose for your map, most of the time the answer would not be Web Mercator. What projection you choose depends on your map’s extent, the type of data you are mapping, and as with all maps, the story you want to tell.
Well, get excited because with a few lines of SQL in CartoDB, you can free your maps from Web Mercator!
-
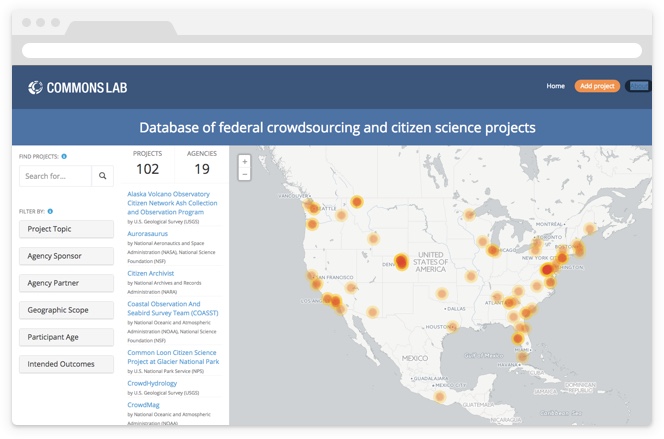
Amidst the growing number of civically engaged public events, federally led hackathons, and public development projects, the question has arisen, where can all these projects and information sources be consolidated?
-

Looking for a digital service that offers an understanding of data complexity that leads to smart decisions, that make people’s lives easier? Looking for a conference that can offer all these things too?
-
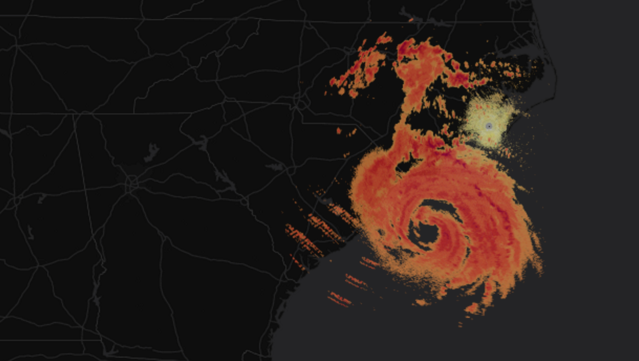
The National Oceanic and Atmospheric Administration (NOAA) has just partnered with Amazon Web Services to make a huge amount of historic and current radar data publicly available. In this tutorial we will show you how to use CartoDB to map this data to explore weather!