-
The ideal intelligent city model is one where technology and data serves the goal of improved standards of living, sustainable use of resources and pollution reduction. And location data has a critical role to play in getting there.
For officials and citizens looking at planning and metrics for water, traffic management, lighting and construction, integration of information from city departments is necessary. Data must be presented in accessible formats for efficient management and response times.
-

We are happy to announce our new CartoDB Ambassadors page — we want to reward our our influential mappers for all their great work in CartoDB! As an Ambagitssador mapper, you will be able to display a portfolio of maps on our site, with increased visibility in the mapping community. We will blog about your projects, and share them throughout the CartoDB community.
-
Lewis and Clark. Armstrong and Aldrin. Williams and… Williams? If you’re going to achieve great things, it’s imperative that you pick the right partner. Someone you can trust, and who offers talent and vision.
-

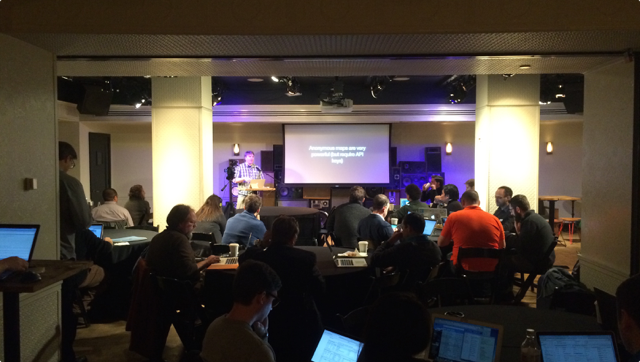
On December 1st, 2nd and 3rd, the Madrid Municipal Congress Centre will host one of the most important events in the digital sector in Spain, the International Digital Content Forum (FICOD) 2015.
This year the attendees of the conference will be greeted with visualizations by CartoDB on a giant screen. CartoDB is proud to be hosting a booth at the event, along with talks and workshops — we hope to see you there!
-
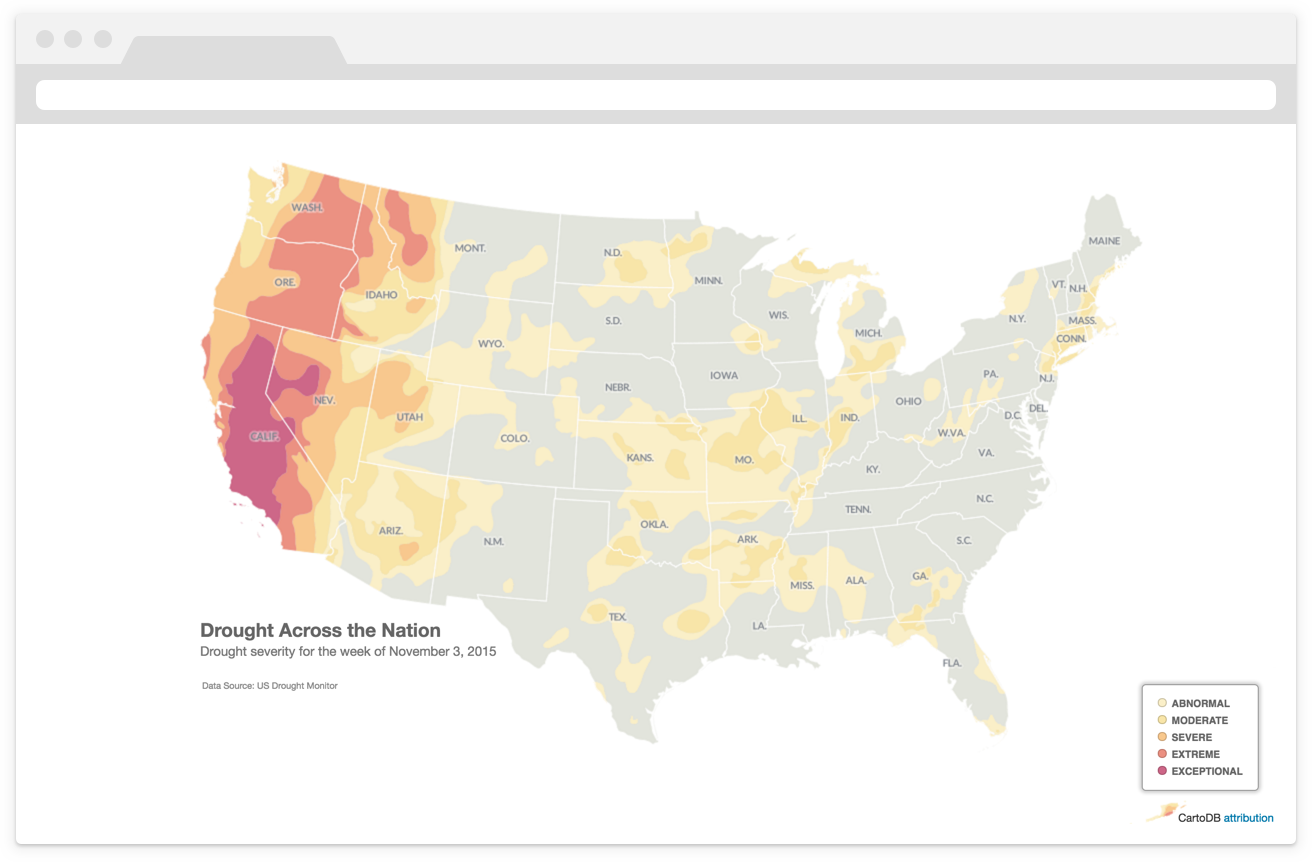
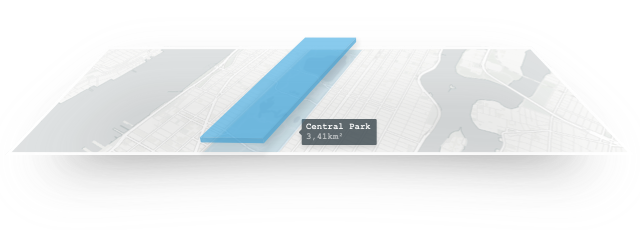
The most common maps built with CartoDB highlight a specific topic or theme of information. Cartographers refer to these as thematic maps. Typically, thematic maps have two components: a basemap and a thematic overlay.
The logical ordering (or visual hierarchy) of elements on thematic maps is especially important. The thematic layer should be highest in the visual hierarchy designed with bold colors to stand out against the more subtly
designed basemap.Building on these ideas, and this previous discussion on map projections in CartoDB, this blog walks through the steps to make a thematic map of current drought conditions in the United States using data from the United States Drought Monitor.
-
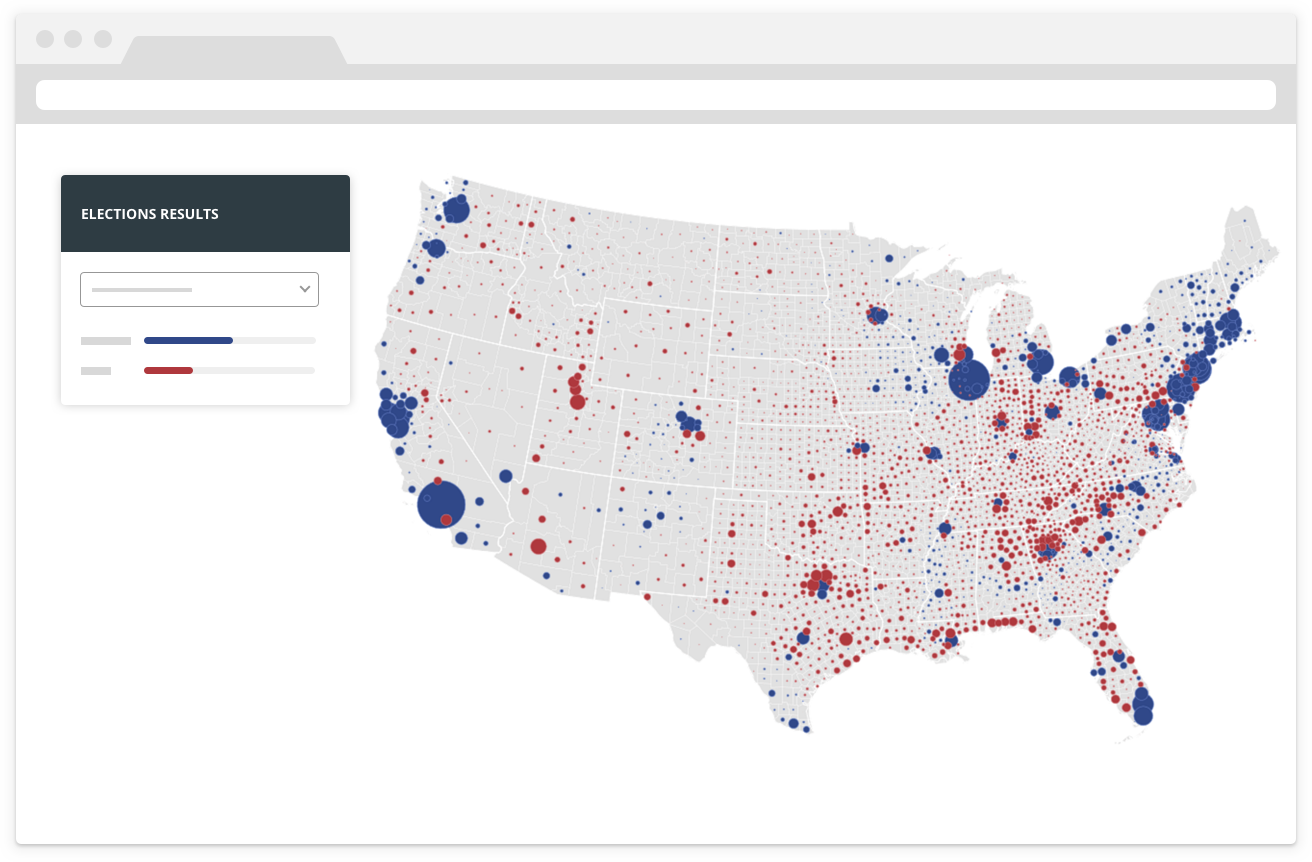
Election season is fast approaching! How can news outlets and media agencies set themselves apart from the rest of the articles on the campaign trail? Data-driven visualizations that’s how!
-

All over the world, tech giants and startups are reshaping the future of the digital economy. There is no doubt that the web is changing the way we do business. More and more, what happens in the digital space will affect how and what
we consume. -
What are smart cities? A catchy phrase or a real movement for change, or something in-between? It is true that the challenges facing cities are real: aging infrastructure, rapid development, climate change, and populations growing at unprecedented rates. To keep pace, future cities must be more agile and inclusive. City agencies are looking to do more with less, and to do it more efficiently. Cities have become testing grounds for tech innovation, and increasingly citizens are leading the process or collaborating directly with
city agencies. -

CartoDB recently moved to an amazing new office in Bushwick, Brooklyn. With over 25 employees, we were bursting at the seams in our Williamsburg office and needed to find a spot that would allow our team to expand into our
next phase. -

CartoDB is excited to announce a series of webinars designed to meet your industry specific needs.
From now to March 2016, we will host a once a month series of 45-minute webinars that are focused on various professional sectors. During these webinars, we will share with you all the relative visualizations related to the webinar topic, as well as give you tips about how to get the most out of CartoDB for your sector. We’ll also share with you resources that are useful in creating stunning data-driven visualizations.


