-
We’ve got a theory that mapping the global impact of data and information helps create better, more socially aware, and global citizens.

-
Take a look at some of the most well-trafficked maps in our gallery and it’s not hard to understand how often data-driven journalism underscores great maps, and how common the contribution of reporters is to our community at CartoDB. To support this growing group of cartographers in newsrooms, we’re hosting a two-day conference in two weeks and you’re invited! Read on to learn more about our schedule, our speakers, and how you can score tickets!

-
On May 13, 2015 from 10 a.m. - 11 a.m., CartoDB will participate and host a session of NewCo at the CartoDB Brooklyn Office - 143 Roebling Street, 2A. Chief Science Officer Andrew Hill will present on the mastery of visualization and location and how emerging geo-technology platforms and tools are changing the way we see and understand the world around us.
-
This past Saturday, an epic earthquake devastated Nepal, resulting in a profound death toll and an impressive response from the humanitarian and crisis-mapping community.
We’ll be updating this post with continuous maps focused on the Nepal region, the aftermath of the tremors, and the humanitarian response flooding media reports and Twitter testimonies globally. Read on for a summary of some informative maps and some how-tos on embedding maps in your next report.
Updates as of 6/27/15 22:50 EST.
-
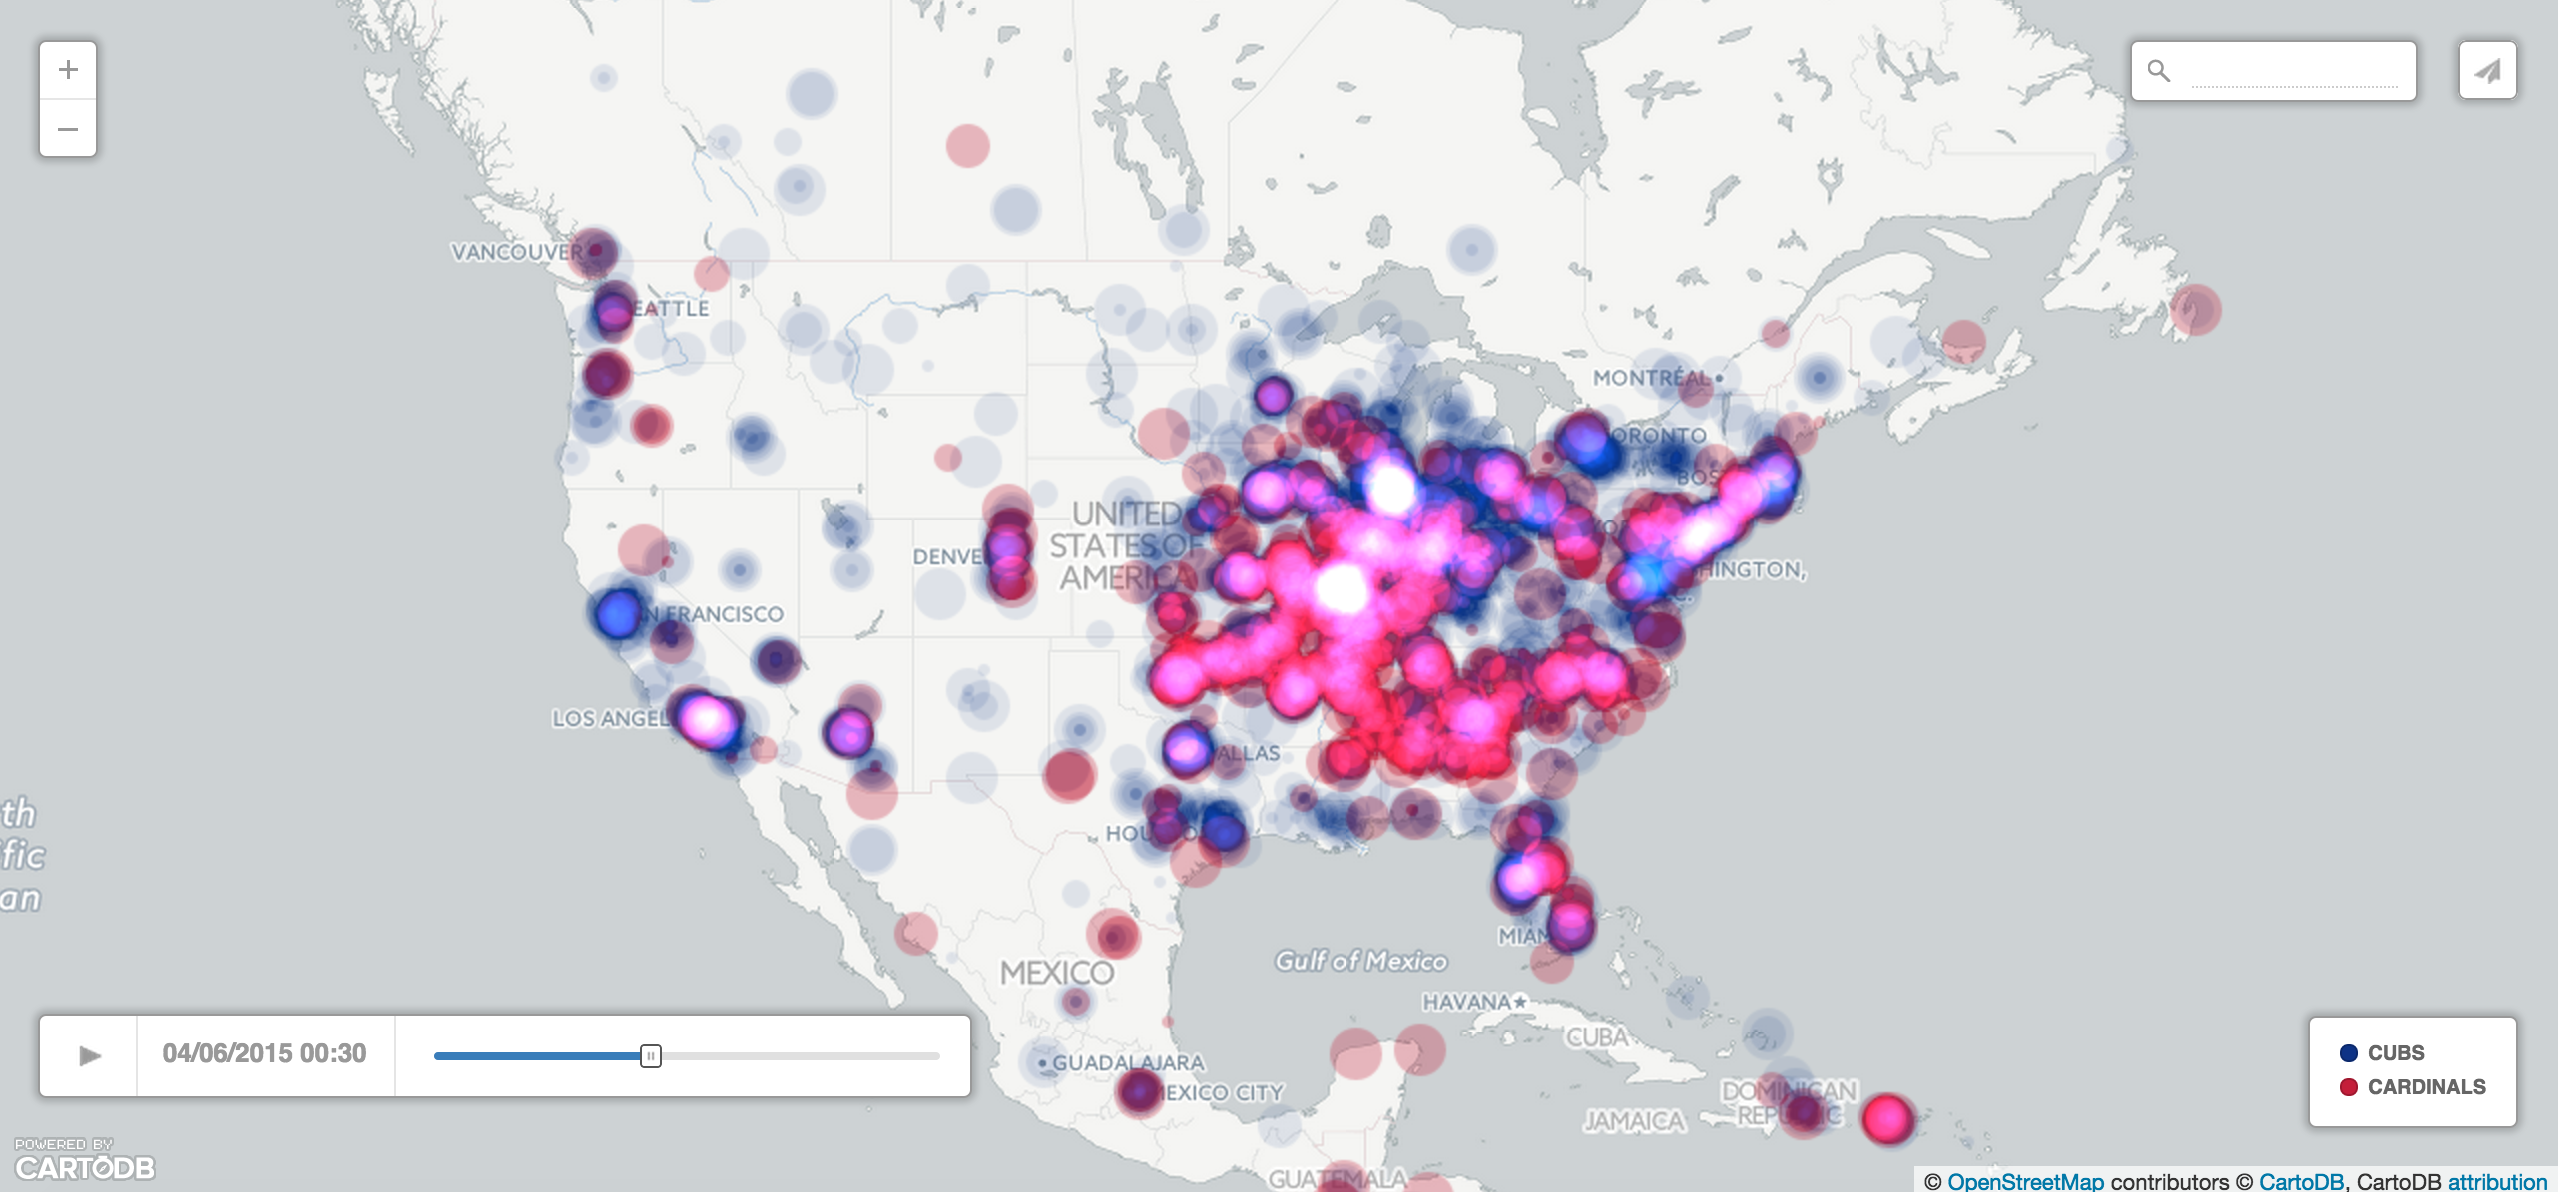
Many things herald the long-awaited arrival of spring - sunnier weather, leafier trees - but no springtime event is more exciting to baseball fans than Opening Day! On an appointed day in April, all 30 Major League Baseball teams open the new season enthusiastically with 15 back-to-back ball games.
While our Madrid office tends to pay more attention to another kind of “‘bol” sport, this year’s MLB Opening Day was super exciting for us in CartoDB New York because MLB asked us to create a series of Twitter maps for each and every opening day game! How often does baseball and cartography collide?! Mapping Tweets for each team’s hashtag during their game turned out to be a great way to visualize the ferverous excitement of fans and even uncover some interesting stories. Take a look at what we found!
-
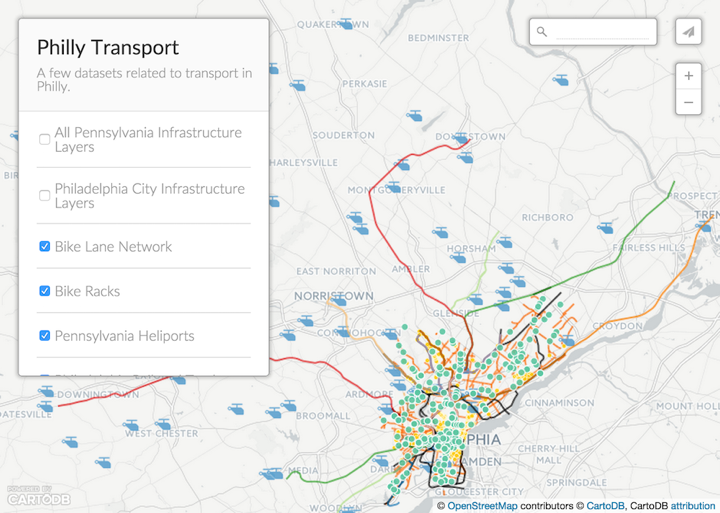
“How many layers does CartoDB support?” It’s a question we hear often. The word “layer” has been a part of the GIS nomenclature since the times of John Snow, and the geospatial community is used to thinking in terms of layers. Many of the prevailing desktop GIS software packages support this mode of thinking with “layer browsers” that have checkboxes for roads, parks, tax lots, pipes - in short, each and every type of dataset in the user’s project.
Aye, but there’s the word: dataset! A “layer” is often really just a dataset. Nothing more, nothing less. In a relational database environment, like CartoDB, individual datasets are stored as tables. And since PostgreSQL (and therefore CartoDB) can support thousands and thousands of tables of data, the answer to “how many layers does CartoDB support?” is pretty much as many as you would like! If you need to, this makes creating a “geoportal” site to all your organization’s geospatial datasets no problem at all.
-
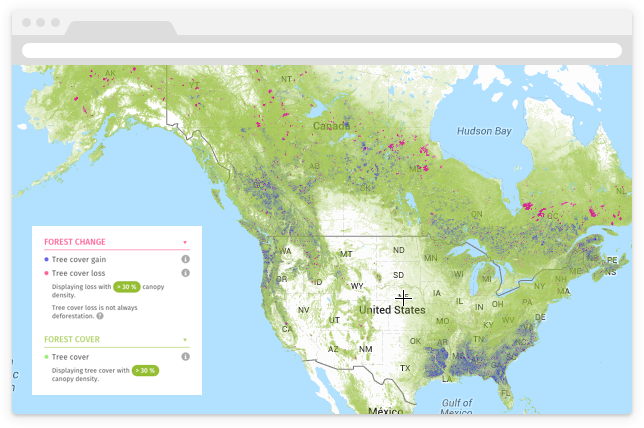
At CartoDB our toes grow green. That is to say, we love our planet, environment, biodiversity, clean water, and all great things that envelope our shared hunk of rock in space. So Happy Earth Day! Celebrate with us by reaching out to your favorite organizations, getting out on your favorite trails, and of course, exploring some of your favorite environment maps :)
-
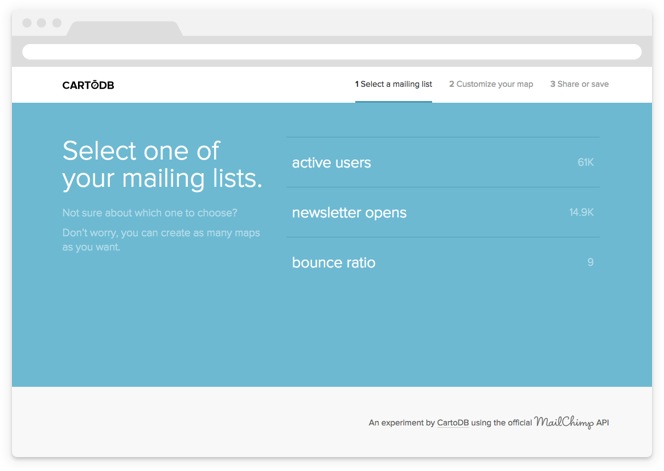
It’s time to get that marketing data analysis monkey off your back, and CartoDB is glad to help! We are excited to introduce the new MailChimp Connector, a feature that melds our mutual love of efficiency and awesome geospatial visualizations with the data captured by a leading Email Server Provider.