-
Last night the Carolina Panthers were smothered by the Denver Broncos in what ended in a two-touchdown lead game. How did the U.S. react? What did they think about that last call on possession? Will we ever come to a consensus on whether Beyonce stumbled during her performance?
-
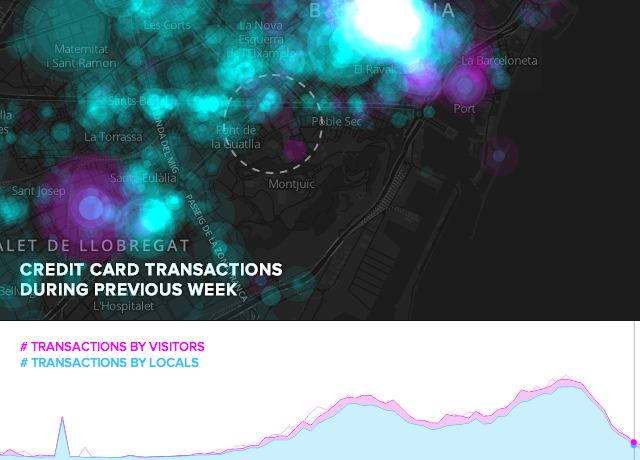
2016 is off to a great start! Now that we’re one month in, it is time to set the tone for the rest of the year and some of that planning and insight is best visualized. Some industries are already making the most our of data-driven visualizations and their business intelligence.
-
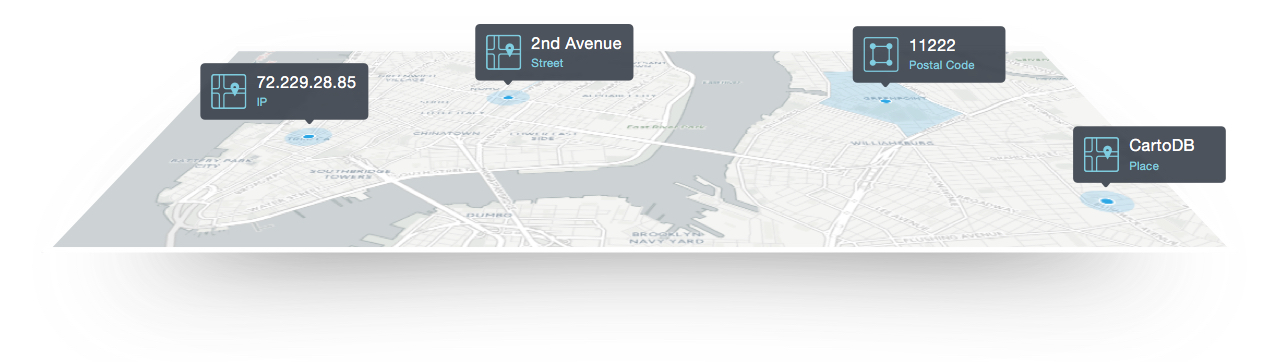
Did this past weekend’s East Coast blizzard leave you with the feeling of wishing you could pinpoint where you built that wicked igloo during Snowstorm Jonas?
-
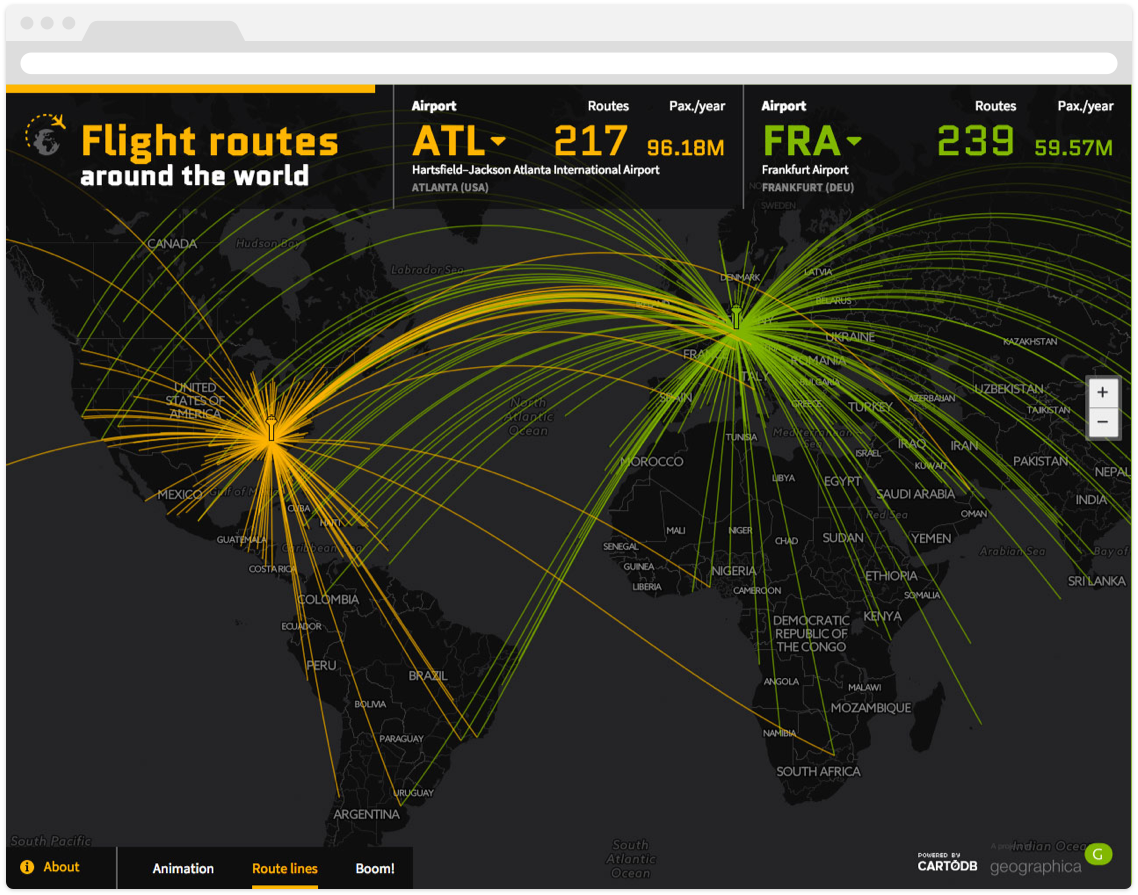 What’s the busiest airport in the United States? That simple question led Geographica on a path to insights and analyses of airports and flights all around the globe. Geographica specializes in software solutions to sort, analyze, and visualize data. Using CartoDB, they developed a data-driven visualization to derive insights on thousands of data points.
 -
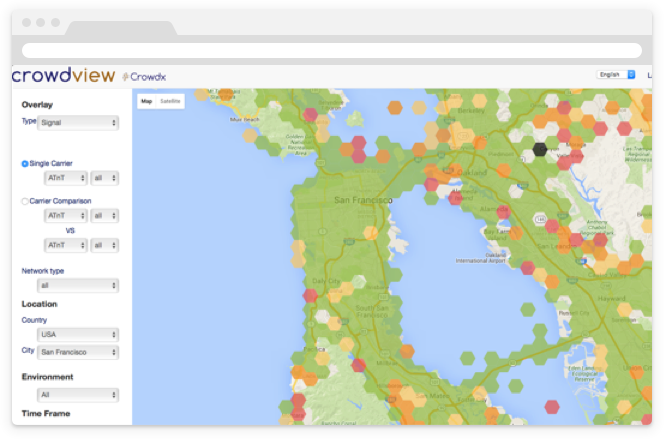
Wait… My call’s dropping… I think my phone is breaking up. Darn it! I’m not getting any wifi signals so all my iMessages are turning into green SMS texts instead of the placating blue. Many telecommunications agencies work relentlessly to provide solutions to many of these and other customer related problems.
-
 For two days, CartoDB will be at the Big Data Innovation - Las Vegas Summit! From January 28-29, we will participate in world-class presentations, panels, discussions, and networking.
 -

Mobile World Congress 2016 is now just a month away! We are happy to participate again in the world’s largest conference for the mobile industry, organized by GSMA. This global event in the mobile tech industry will take place in Barcelona at Fira Gran Via from February 22-25.
-
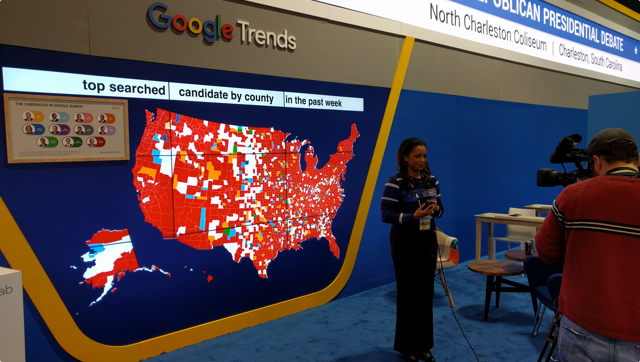
With less than a month away before the first U.S. presidential primaries, all eyes are on the headlines for the latest jabs by Trump, Hillary, and the gang. Just how do journalists get the spin on the topics and trends this election season?
-
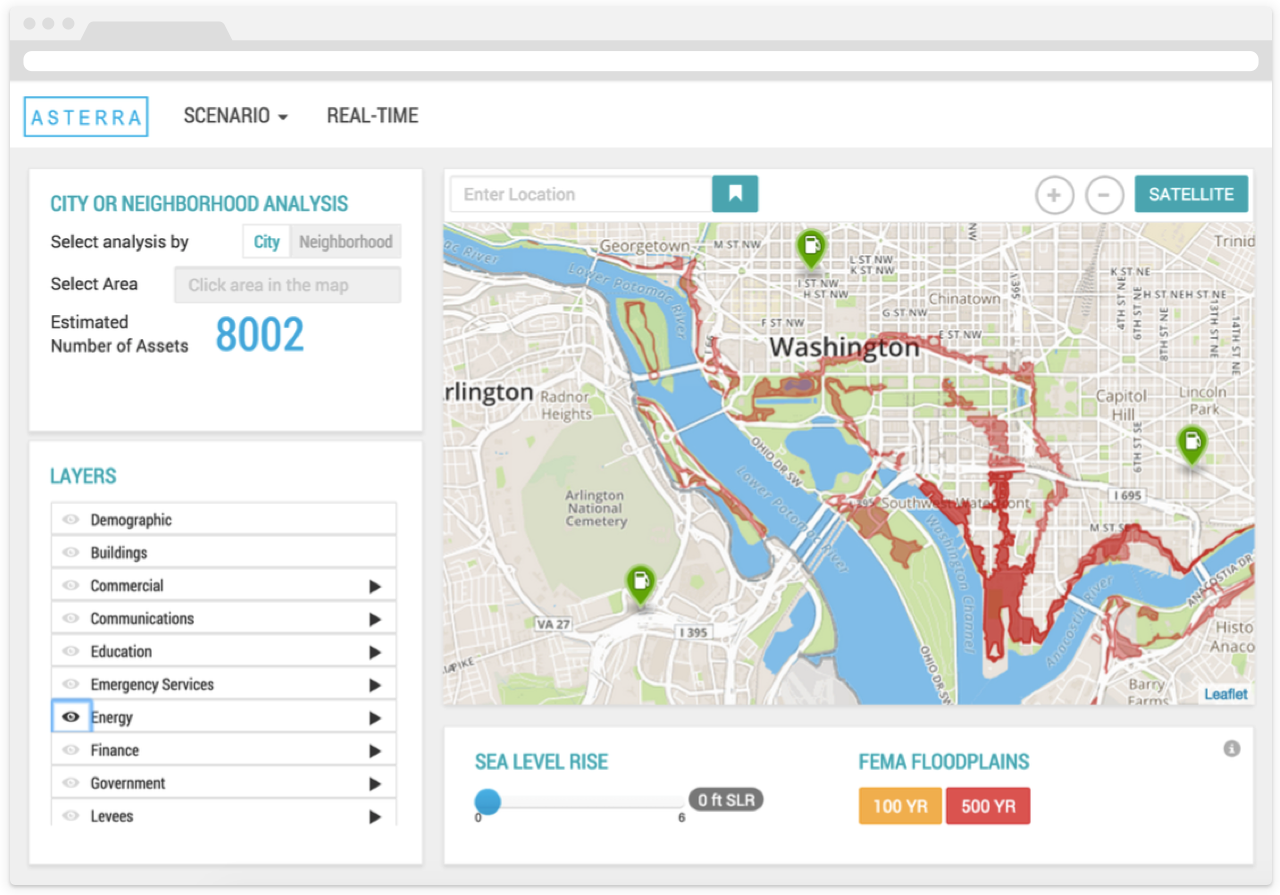
After COP21, it is expected that more and more cities will work towards implementing a solution to climate changes that have adverse affects on infrastructure and populations.
A CartoDB partner, Vizonomy, created a risk platform analysis dashboard, using open government data - for this specific reason. The dashboard allows communities and businesses to see infrastructure and populations vulnerable to a rise in sea level and flooding.
-

CartoDB is very excited about the upcoming FOSS4G-NA conference!
We’ve given sessions at the conference for the last 2 years and hope 2016 won’t be an exception. Held in Raleigh, North Carolina from May 2-5, this is the premiere conference for free, open source software designed for geospatial in North America. Thousands of participants and hundreds of companies converge to share, demo, and talk about the things we love most.
In order to see us there we need your help!


