-
The news heard by millions of straphangers around New York City last week was Metropolitan Transit Authority’s (MTA) proposed repair to the blighted Canarsie Tunnel, the vital connection used by the L train to connect Manhattan and Brooklyn under the East River. Due to extensive damage caused by flooding from 2012’s Hurricane Sandy, the restoration will have large consequences for L train riders in the near future. How massive and where those consequences can show up, can be understood better using a bit of location intelligence.
-
Real estate is a great sector to leverage deep insights using location intelligence. Properati, a property search portal with a strong presence in Latin America, aims to improve the experience of purchase, sale and rental of real estate. Currently the site operates in Argentina, Brazil, Chile, Mexico, and Colombia with over one million properties listed.
-
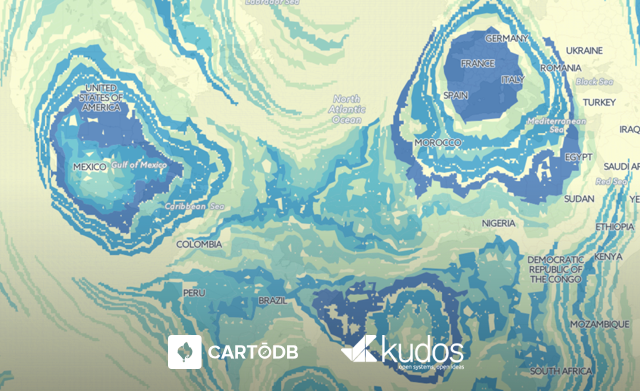
GKudos, a CartoDB partner, is a GIS visualizations firm that specializes in the management, analysis, and publication of geo-referenced information. One of their goals is to help customers have increased productivity and competitiveness through the use of information technology and telecommunications.
-
“Find me the nearest…” is a common way to start a geographical query, and we’ve talked about how to write such queries for single points, but it can be tricky to carry out in bulk.
CartoDB supports high performance “nearest neighbor” queries, but getting them to run in bulk on a whole table can be tricky, so let’s look at the SQL we need to make it happen.
-

A warm welcome to Javier Goizueta, who joined CartoDB to take our data services to the next level.
-

Organization owners are now able to manage users in their organization with our new Enterprise User Management API!
-
The NYPD recently made waves with an open data release, sharing fairly detailed crime data about the “seven major felonies” for the first 3 quarters of 2015. The dataset has a row for every incident, including location (as lat/lon), date/time, etc. However, as with many crime datasets, the point locations have been adjusted to mid-block or nearest intersection so that you can’t determine exactly where the reported crime occurred. As you might expect, there are many locations in NYC where multiple crimes occurred on the same block/intersection, so we end up with many rows that have the exact same point coordinates. This is a mapper’s conundrum, as point markers will simply overlap each other, only allowing you to see the one point when there are many beneath it.
-
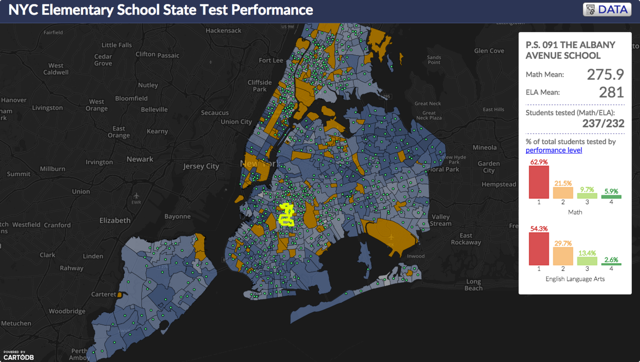
Many universities around the world use CartoDB, for research and in the classroom, to create interactive tools for educators and departments. Types of visualizations vary from historical occurrences, natural events, predictions, economic trends, population performance, and disease evolution.
View how test scores are visualized per school district in polygons to show elementary school student performance in New York City.
-
Join CartoDB scientists Andy Eschbacher and Stuart Lynn, fellow geospatial data wranglers, and web cartographers at our Intermediate SQL workshop on Tuesday, January 12th!
-
Have you ever had trouble making your map look legible when it has a large numer of overlapping elements? Have you ever wanted to control subtle effects when one geometry overlays multiple geometries of different colors? You can solve all of these problems and more by using the composite operations baked into the CartoCSS map design language!


