-
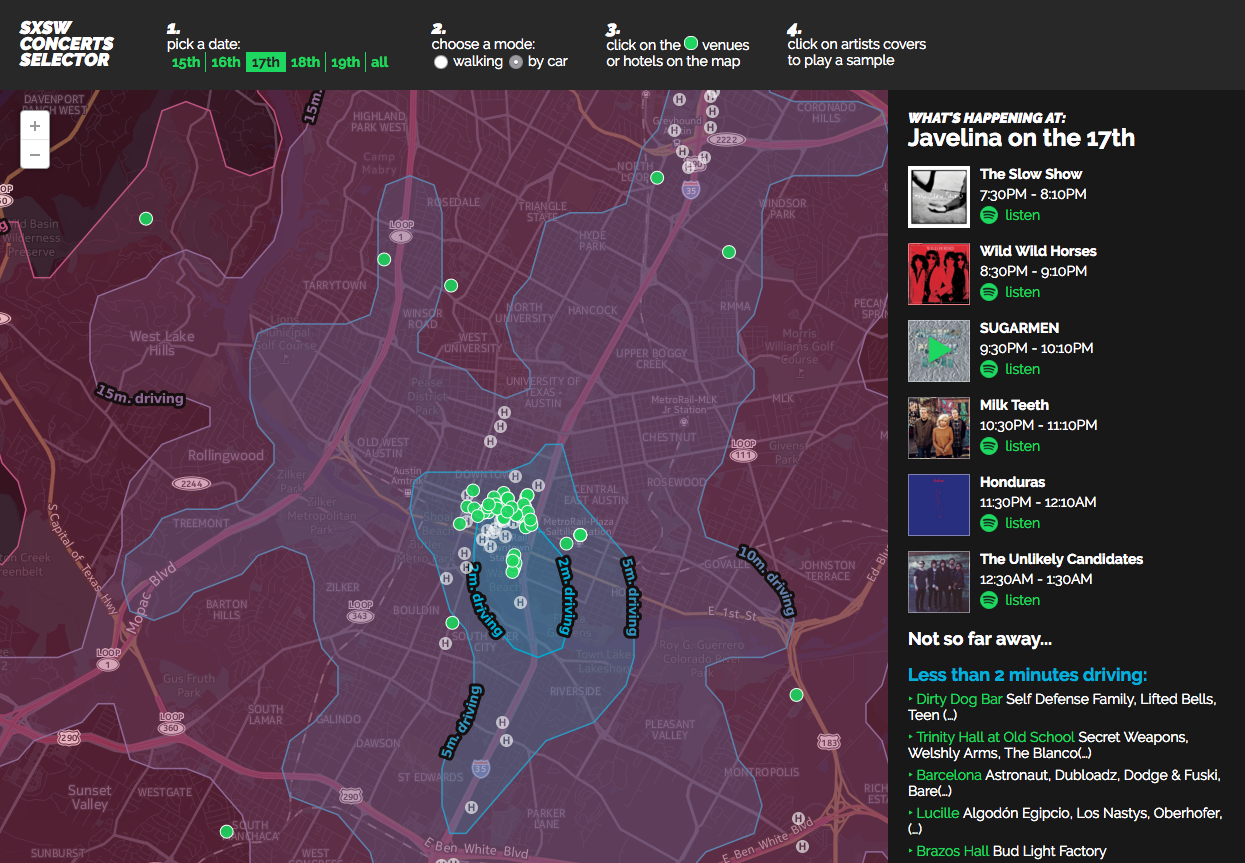
Planning where to strategically go next can be a daunting task. There are numerous factors to consider, like time. At major festivals, like SXSW, planning how long it takes to move from place to place doesn’t have to be so intimidating anymore. Time and Distance Isolines (also called isochrones), a new feature coming to the CartoDB platform, allows you to measure time directly through SQL statements. Time isolines provides insight and analysis on how long it takes pedestrians to move from one hotspot to the next, making tactical business planning a cinch.
-

CartoDB began 2016 in a disruptive way by expanding location intelligence around new industries, countries, and devices. To continue to disrupt this space we need amazing explorers to join our team! We still have about 10 open positions for different departments, such as Marketing, Sales, and Product, to work in our New York and Madrid offices.
-
When calculating distances on maps, often we simply compute the ‘as the crow flies’ distance: the length of the straight line that links our origin and destination. For human-centric uses, this is rarely the correct approach as it ignores the fact that we cannot walk on water or pass through solid walls. Instead, we have to navigate among obstacles such as buildings and one-way streets. For many tactical business decisions, we need to use the distance someone would
actually have to walk or drive to get from A to B, which can dramatically change the results.To solve these problems, we introduce isolines. Isolines are a way of measuring how far a person could realistically go from a location in a given time with all the buildings, streets, and other obstacles in their way taken into account. Since they can go in many directions, the lines are the boundary of the surface of all possible end points.
-
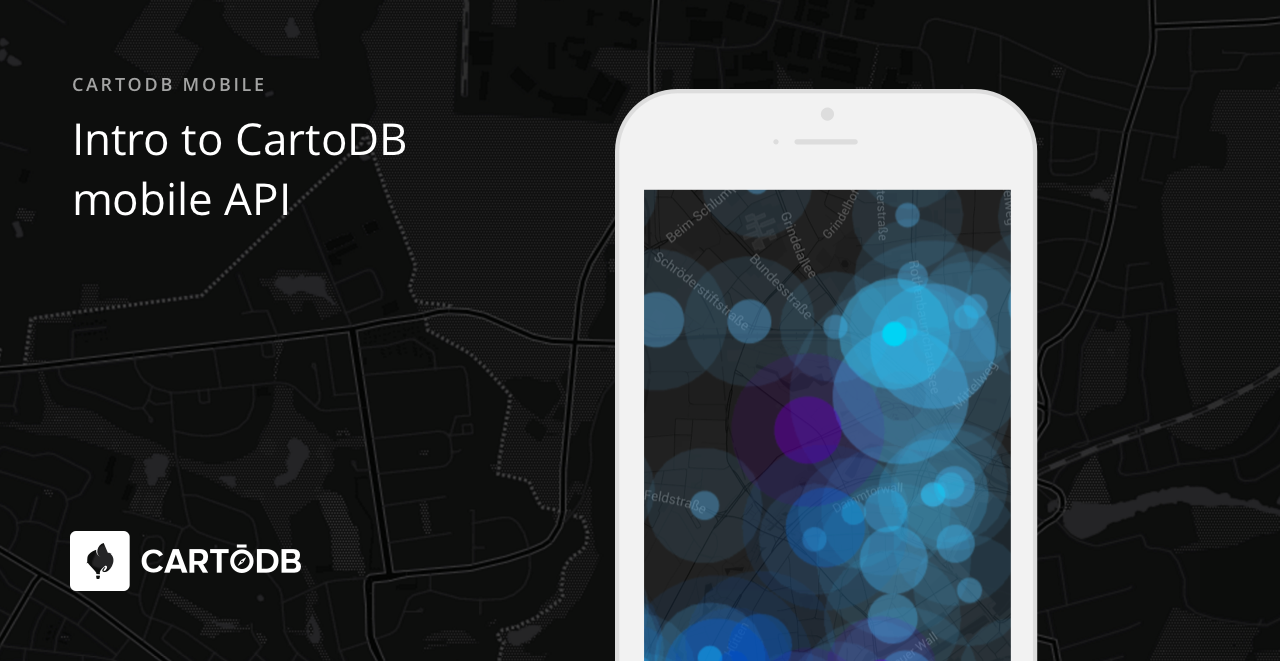
My name is Jaak and I am the Head of Mobile of CartoDB’s newest division, Mobile. As CartoDB embarks on the innovating the field of mobile development, we wanted to keep you up-to-date on all the latest and greatest developments happening here. I’d like to start the Mobile SDK series by introducing the native mobile capabilities of CartoDB on both the general and technical levels.
-
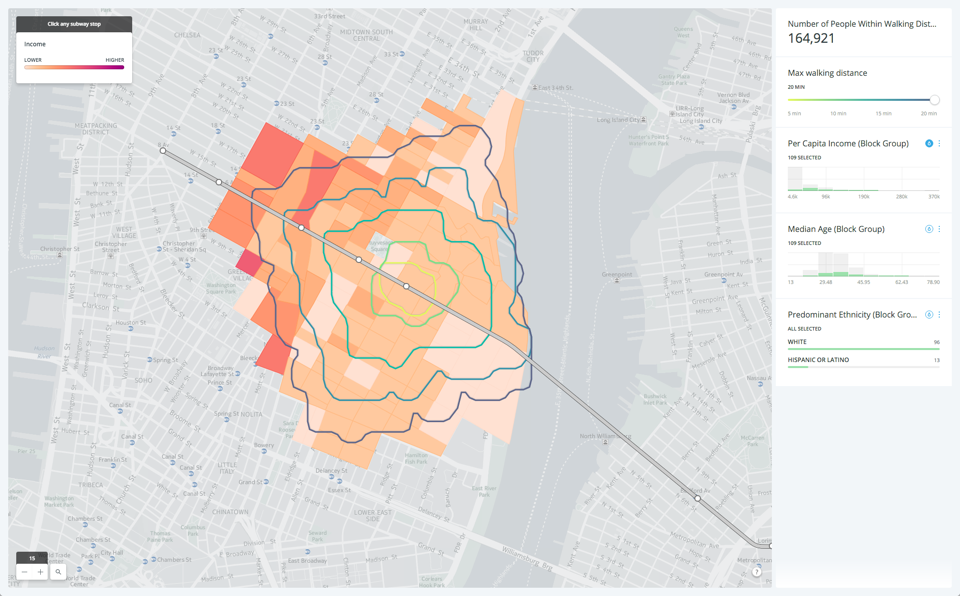
Airbnb has become a lightning rod for controversy about the so-called sharing economy. In tight housing markets – in particular, New York City and San Francisco, many have claimed that Airbnb contributes to the displacement of longtime, poorer residents.
While these reports are alarming, none have tried to map the major concern – concentrated neighborhood impact from Airbnb’s heavy concentration in small parts of cities. By leveraging US census data in CartoDB’s Data Observatory, it’s possible to isolate the impact of Airbnb to a the level of just a few city blocks.
-

CartoDB happily moved to Bushwick from Williamsburg last September. Our office is in the middle of the industrial zone, with vast spaces around and graffiti art on the walls, and has ample room for up to 120 people where we love to host events, as well as the outdoor space in the summertime.
-

What a year! We can still feel our presence in Barcelona after MWC 2016 and we keep coming back for more of that great energy. This time, Sergio Álvarez will be speaking at eFintech Show. CartoDB is one of the 30 most disruptive Fintech Startups selected by an expert group in a single event.
-
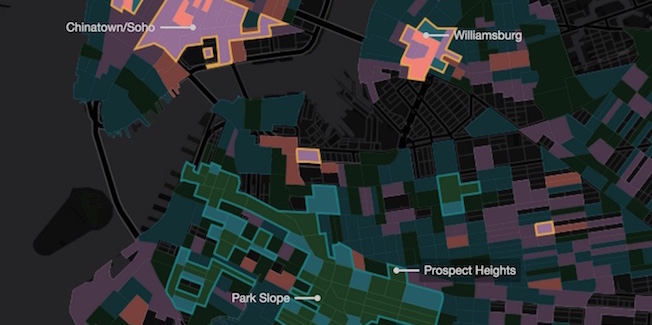
One of the most common reasons people make maps using CartoDB is to try and explore the patterns in their data in order to make better decisions or to communicate interesting ideas. This exploratory approach to location intelligence can be difficult, but armed with the right analytical workflows and cartographic approaches people can create incredible new value simply by using a map. In today’s blog post, I’m going to introduce a lesser-known method that can help you find interesting patterns in polygon data that a simple thematic map (e.g. a choropleth) alone may allow you to overlook.
-
You might have seen the blog post we produced a little while ago looking at the
L train closure and the possible impact that might have on L commuters to manhattan. One of the most visually striking elements of that post were the maps where we showed walking routes for people in Brooklyn to their nearest L. We did it a few times, once like above showing all people in Brooklyn, and a second time showing cumulative walking corridors for people that live on the L. You might have wondered how we made those lines, so in this post we will show you how.